Mobile app
The GLONASSSoft mobile application can be downloaded from Google Play and the AppStore. If necessary, we can prepare a personalized version for you.
We offer you to learn about working with the application in a short video:
The GLONASSSoft mobile application will allow you to conveniently use the system from the smartphone screen.
Once you have downloaded and installed the application, by logging into it, you will be greeted with an authorization screen:
Here you need to enter your username and password to log in. The login details are the same as for the web version of the system.
If you do not have login details yet, you can use the demo version of the user by clicking on the Demo mode field .
Information about additional features of the authorization screen in the article: Login to the mobile application .
After authorization, you will be greeted by the Clients screen with a list of available clients.
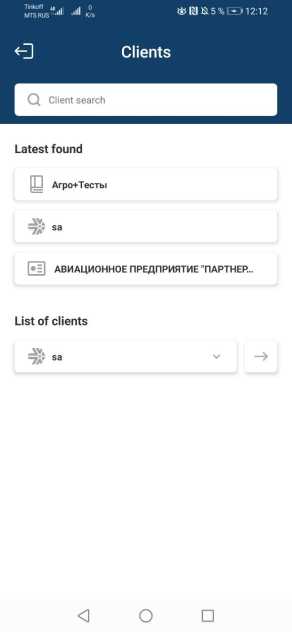
To display a list of clients, the user must have the View Clients right . If the user does not have this right, the client list window is skipped; after authorization, the entire list of objects of the client to which the user belongs is immediately opened.
On this screen, you can select the client whose list of objects you want to display for monitoring.
The top client is the client that the user belongs to. This client may have other clients under its control.
In order to switch to the monitoring of all objects of the client Agro + Tests, you must click on the button  with an arrow next to the name of the client.
If you need to expand the list of clients, click on the field with the name of the client.
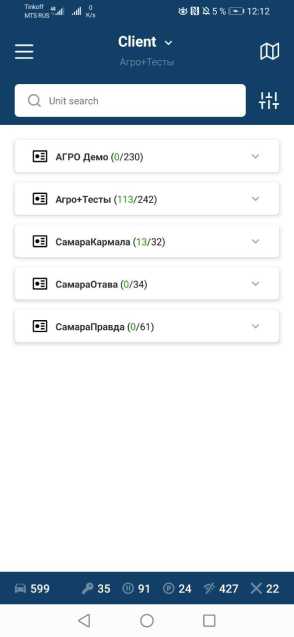
In the drop-down list, you can click on any client and go to its list of objects.
List of objects
The list of objects consists of object cards.
From the object card you can learn about:
- Object name and model
- Object status and last message arrival time
- The operation of the ignition sensor
- Object location
- The value of installed sensors
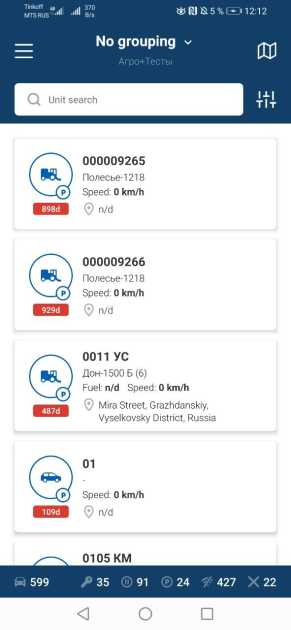
The list of objects can be grouped, search for an object from the list by the name of the object, select some of the objects by status.
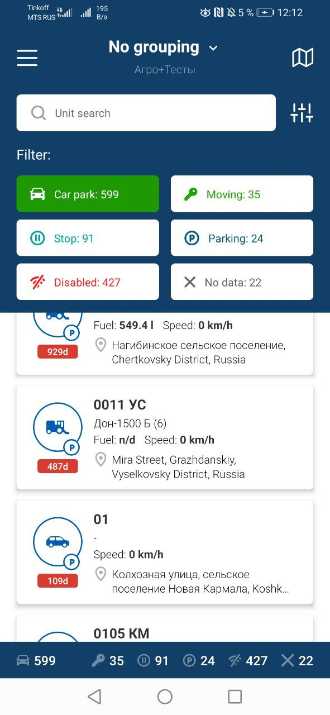
Also from the object list window you can go to the menu , create an object and go to the map .
If you swipe the object card to the left, you will be able to send commands and build reports on the object.
You can learn more about all this by clicking on the links to the relevant articles.
At the bottom of the screen there is information about the number of objects and their states:
- In move
- Stop
- Parking
- Disabled
- No data
To go to a window that allows you to get more detailed information about the state of an object, click on any object from the list.
Information about the state of the object
The window is divided into two parts: cartographic and informational.
At the top of this window, you can switch to other tabs, namely:
- History - chronology of object events for the selected period
- Info - information from the last message from the object
- Graph - displaying the operation of the object in the form of a graph for the selected period
- Statistics - summary information for the selected period
- Reports - go to the section of reports on the object
In the map window, you can change the selected map layer, set up object track display, zoom in or out, and find your location on the map.
If you press and hold the object, a selection menu will open where you can get a route to the object or copy its coordinates.
If you swipe down the object card, the information part will be hidden and the map will be displayed in a higher resolution.
If during the trip the object visited any geoobjects, they will be displayed on the map.
The content of the information part of the window depends on the selected tab.
To access the information part, the user must have the right: View and generate all reports .
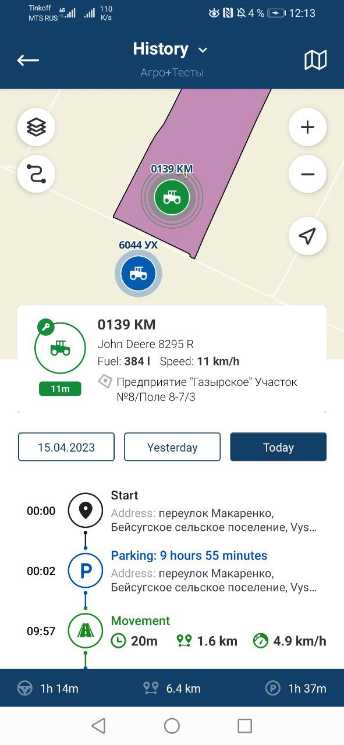
Story
This tab displays the history of events that occurred with the object for the selected period.
Periods are divided into days. You can select a different period, for this you can swipe to the right in the period area and select the day you are interested in.
If you click on the selected period, for example Today , then the object track for today will be built on the map.
You can build a history for an arbitrary period. To do this, you need to swipe the list of dates to the left in order to open the Calendar button . By clicking on it, a window will open where you need to select the period for building the history, then click Show .

You will see a history of events that have occurred for the selected period. When you switch to other tabs, the selected period remains unchanged.
In the chronology, you can get events:
Start - the beginning of movement in the period, supplemented by information:
- time
- Object location
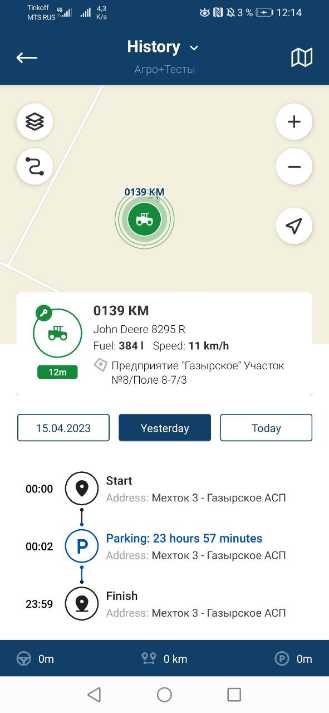
Finish - the end of the movement in the period, supplemented by information:
- time
- Object location
Movement - the period of movement of the object, supplemented by information:
- Start time
- Time in motion
- run
- medium speed
Parking - the period of parking of the object, supplemented by information:
- Parking start time
- Parking time
- Parking location
By clicking on an event in the timeline, an event icon will appear on the map in the place where it happened.
The bottom part of the window displays information about driving time, mileage and parking time for the selected period.
Info
This tab displays information about the state of the object and its sensors from the last message sent by the terminal.
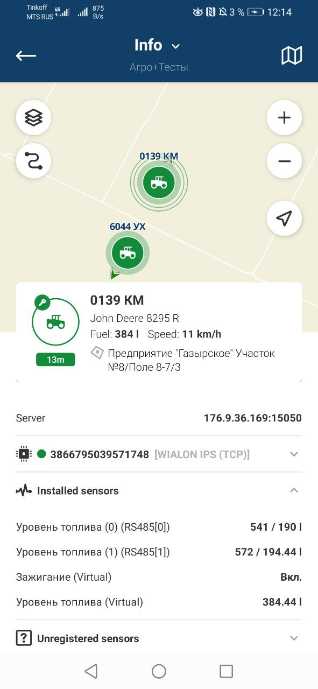
This window duplicates the information window from the properties of the object in the web version of the system.
Schedule
This tab displays the operation of the object in the form of a graph for the selected period.
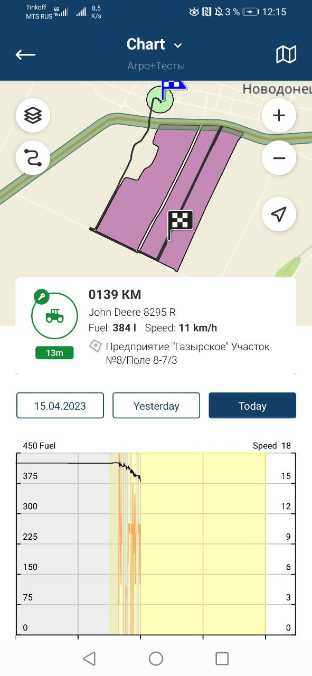
The graph displays parking periods, stops as a background, as well as graphs of speed and fuel in the form of lines.
Statistics
This window provides summary information about the operation of the object for the selected period.
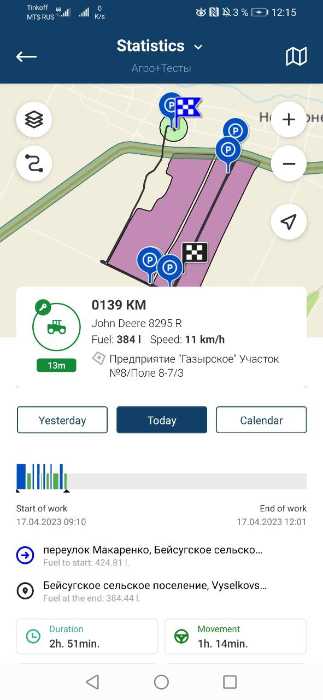
The window contains a periodic schedule for the operation of the object. It displays the periods of movement and stops of the object, as well as icons display refueling and draining fuel.
The start and end time of the work is determined by the movement of the object.
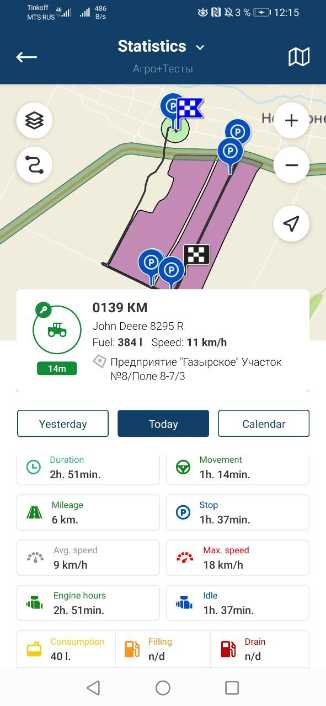
The window also contains the following information:
- Start - displays the location of the object at the beginning of the period, also indicates the fuel level at the beginning of the period
- Finish - displays the location of the object at the end of the period, also indicates the fuel level at the end of the period
- Duration - object operation time, determined by the movement of the object or the operation of the ignition sensor
- Time in motion - time in motion
- Mileage - the total mileage of the object for the selected period
- Stop time - the total time the object was parked
- Average speed - the average speed of the object
- Maximum speed - the maximum speed of the object
- Engine hours - accumulated engine hours of the object
- Idling - time spent idling
- Consumption - the amount of total fuel consumption by the object
- Refueling - the total amount of fuel filled
- Drain - the total amount of drained fuel
- Consumption l/h - average fuel consumption per hour
- Consumption l / 100km - average fuel consumption per 100 km of run
- Consumption according to the norm l / h - the amount of fuel consumed calculated according to the norm relative to the accumulated engine hours
- Consumption according to the norm l / 100km - the amount of fuel consumed calculated according to the norm relative to the total mileage
- Consumption at a rate l/h at idle - the amount of fuel consumed calculated at a rate relative to the time spent at idle
The description of the Reports tab is in the corresponding article.