Sensor trace
The “Sensor trace” report displays data from sensors in the form of a table at specified intervals.
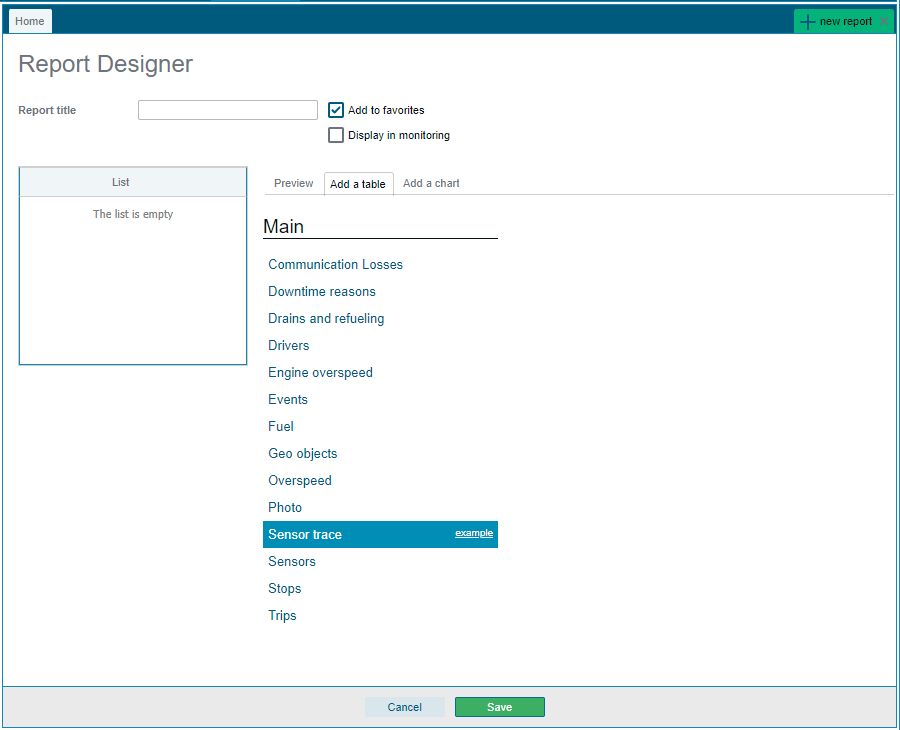
In order to build this report, you need to go to the "Reports" section. Click on the "Create Report" button and proceed to work with the "Report Designer" functionality.
From the proposed list, select the “Sensor trace” report.
After selecting this report, the report table settings will open.
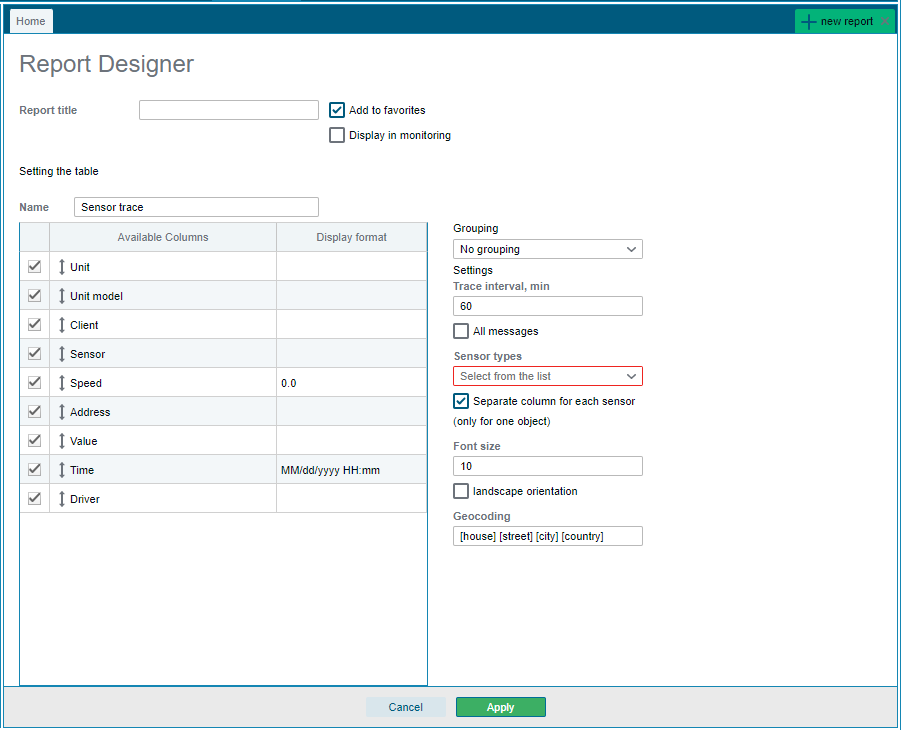
The table name is filled in automatically, but you can also change it.
For the Sensor Trace report, you can select the following available columns from the list provided:
- Sensor - the name of the sensor specified in the "Name" field of the sensor.
- Speed - the speed of the object from the message from which the value is taken.
- The address is the location of the object from which the value is taken.
- Value - digital value of the sensor.
- Time - the time of the message from which the value is taken.
- Driver - the assigned driver from which the value is taken or the one assigned at the time the value was removed.
Next, you need to go to the following settings:
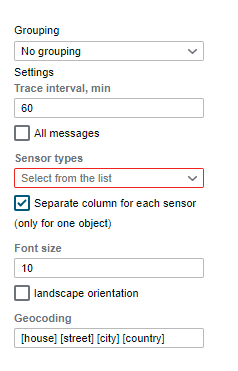
- Grouping - this function is designed for more convenient display of information in the table. You can group values in the table according to two criteria: day; vehicle.
- Trace interval - specify the interval after which the system will search for and display the sensor value from the message, which is closest to the required point in time. If you specify “All messages”, then the data is taken from each message.
- Types of sensors - the type of sensor use is determined and selected from the list of available, divided into groups. The sensor type must match the characteristics of the equipment installed at the facility.
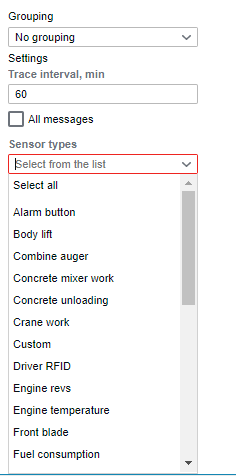
Separate column for each sensor - by specifying this option, a separate column is created in the report for each sensor. The option works only when building a report on one object.
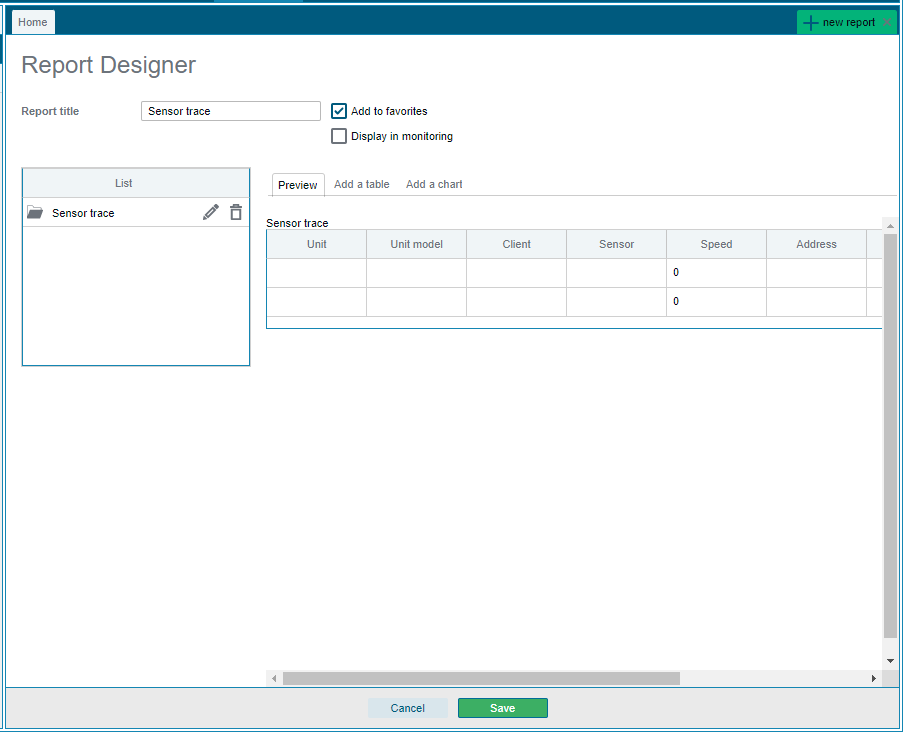
After the report is configured, you must fill in the required field “Report Name”. Next, click the “Apply” button.
Once configured, the report will be displayed in the Preview tab:
Now we need to save the report.
After setting up the “Sensor trace” report, you need to select the required object in the reports section, set the time period and go to the “My” section in the list of reports, this is where the “Sensor trace” report will be displayed:
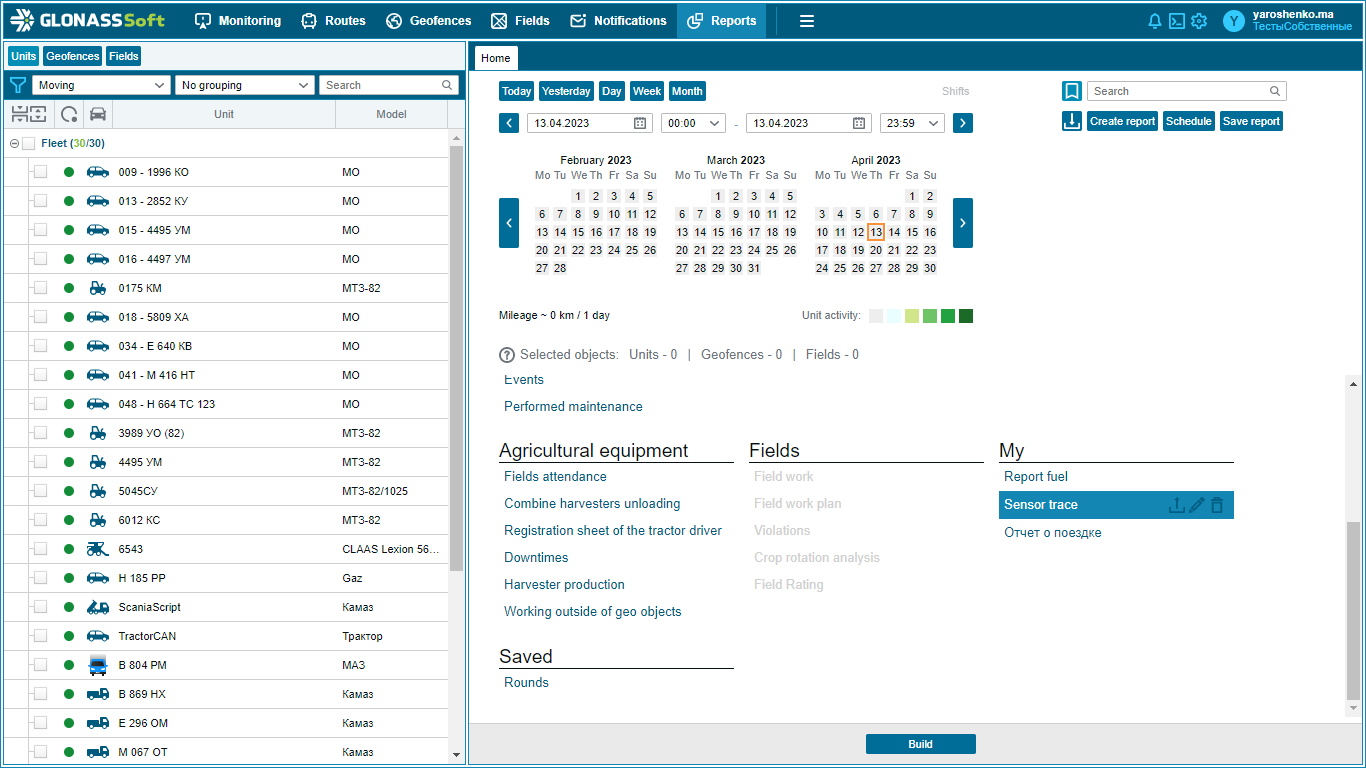
Click "Build".
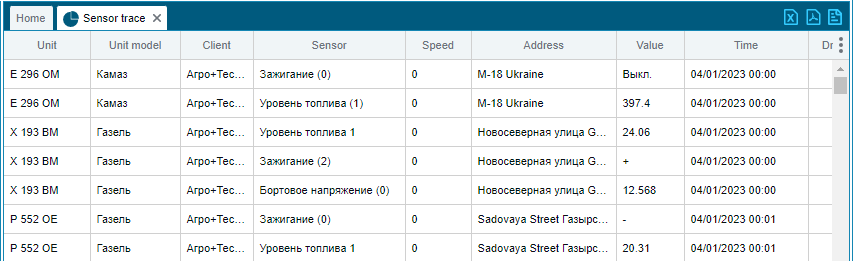
The report looks like this: