Over speed
This report is designed to monitor driving speed. It allows you to track all excesses through the construction of a report, as well as adjust the report settings for your individual tasks.
There are two ways to determine the speed limit for building a report: Fixed limit - you yourself determine the speed limit that your report hits. Road limit - the report will include those violations that correspond to the data on the speed limits of map services.
In the upper right corner, click on the Settings icon  , then select the Reports section. In the Speeding section, you can select the method for determining speeding, as well as set the minimum duration of the violation, that is, exclude short-term violations from the report.
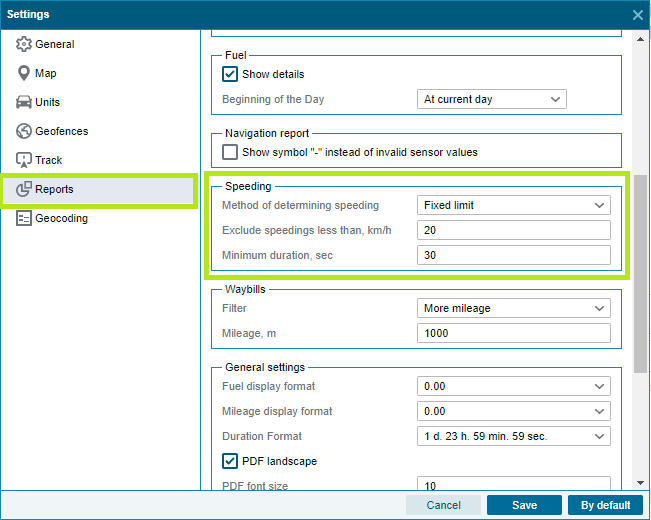
Also below there is a window for entering a non-penalized interval of speed and time for the duration of the violation.
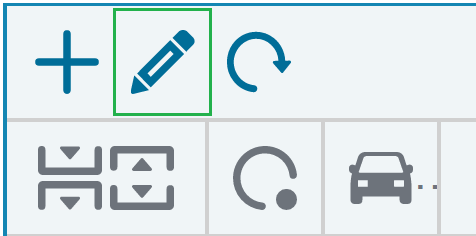
To set the event definition condition on the toolbar, click the Edit icon,
select the Templates section and then Speeding.
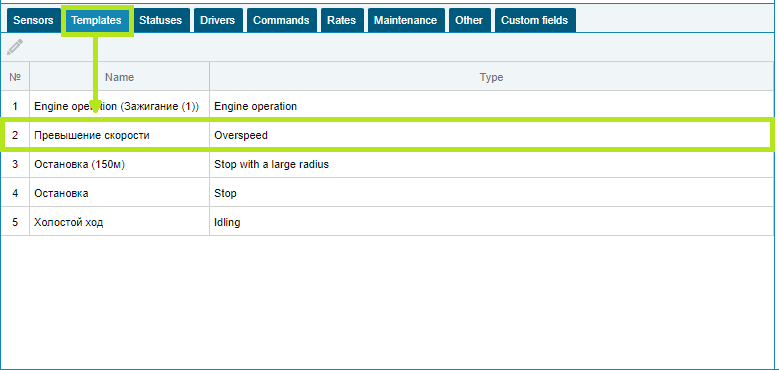
You will see a window for editing the Speeding report template.
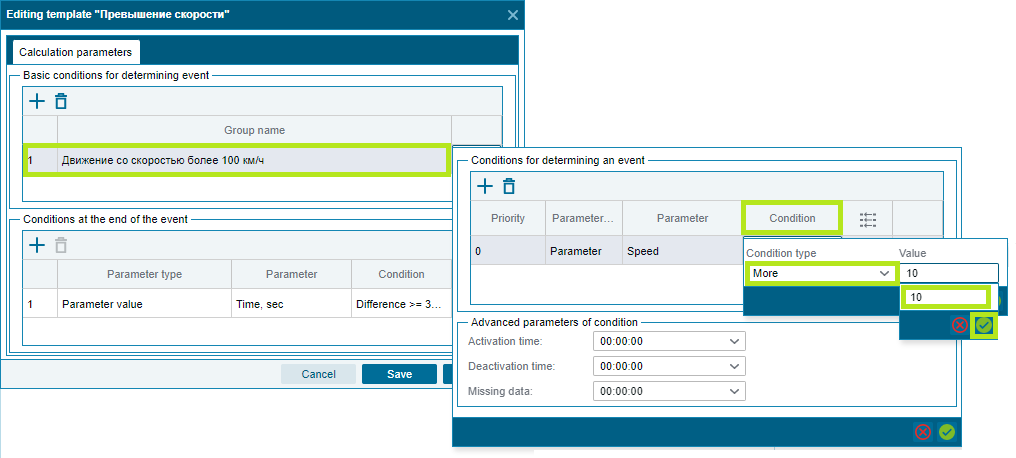
Here you can set the speed intervals included in the report.
Important : when saving the settings of this window, use the button  to close all windows sequentially.
Report settings are now complete.
There are several ways to generate a Speeding Report:
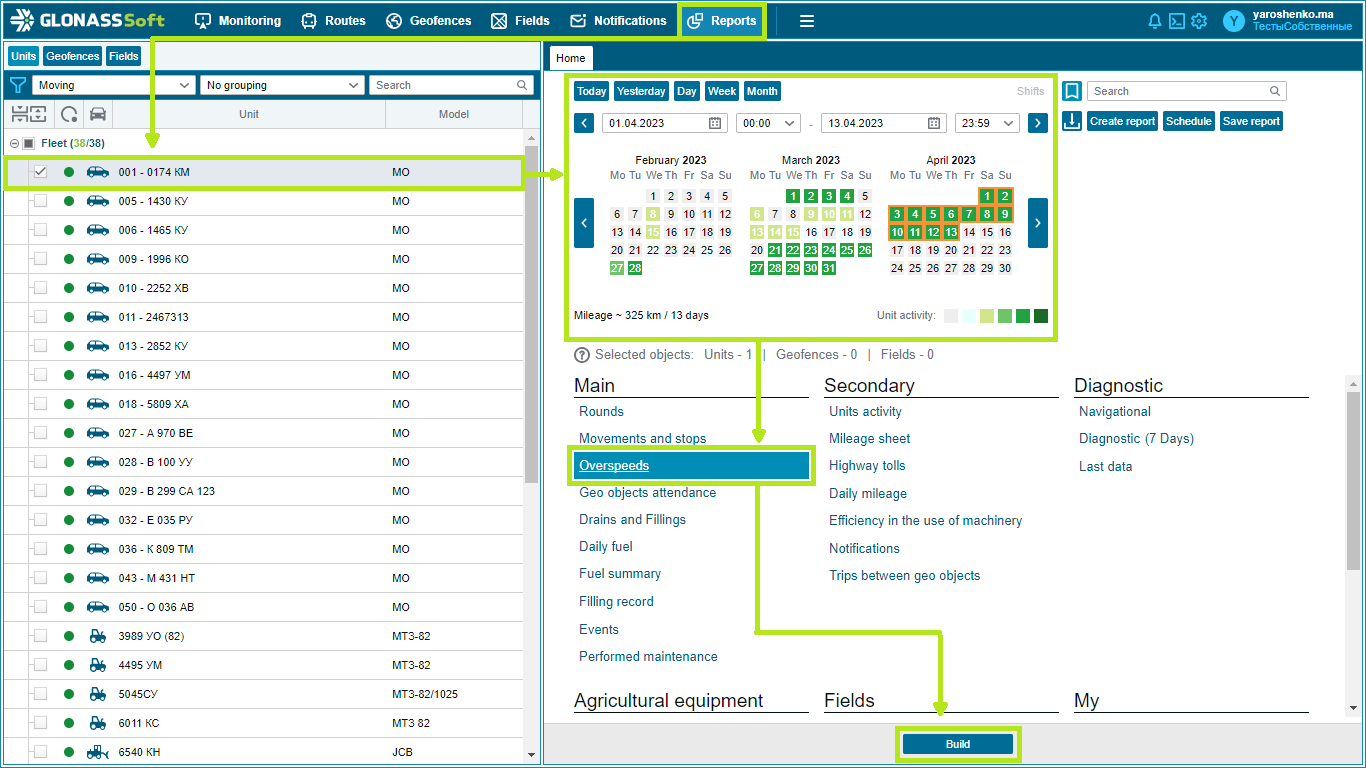
1. Group reports in the Reports section. To build a report, go to the Reports section in the top panel. Then, in the object tree, select the required object and the time interval in the activity calendar. Next, in the Main Reports, select Speeding and press the Build button. The report is ready.
2. Building a report through the Track report. In the Monitoring section in the object tree, select the objects you are interested in and build the history of this object by clicking the Build history button in the right part of the field.
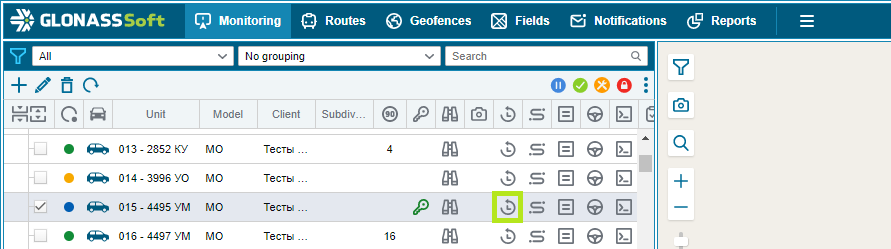
Select the required time period in the Activity Calendar and click build. At the bottom of the screen, you will see the Track report you created.
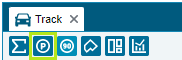
By clicking on the Speeding icon you will see the Speeding subreport.
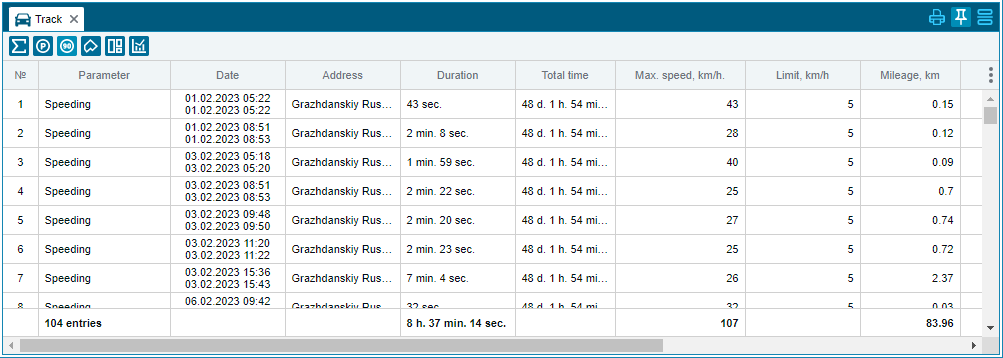
The Speeding report table contains the following columns:
- Object - object name;
- Parameter - the name of the "Speeding" event template;
- Date - date and time of the event;
- Address - location of the event;
- Duration - the duration of the event;
- Total time - the time of the total duration of trips for the selected period;
- Maximum speed, km/h - maximum speed for the period of event activity;
- Restriction, km. - speed limit set in the object template;
- Mileage, km. - mileage completed during the event;
- Initial mileage, km. - mileage in the trip of the object at the beginning of the event;
- Final mileage, km. - mileage in the trip of the object at the end of the event;
- Average speed, km/h. - average movement speed during the period of event activity;
- Driver - the driver assigned to the object.
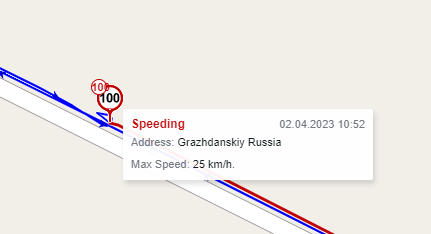
These fields display all the necessary information and speeding objects. The map will also display information about speeding.
The report can be downloaded in a printable form by pressing the button  .
.