Report Designer
Report Builder is a convenient working system tool that allows you to create and customize reports in a way that is convenient for the user, save them in this form and make them available for use by other employees.
To start working with the report designer, you need to open the "Reports" section. The main page of the section displays a calendar showing the activity of the monitoring object.
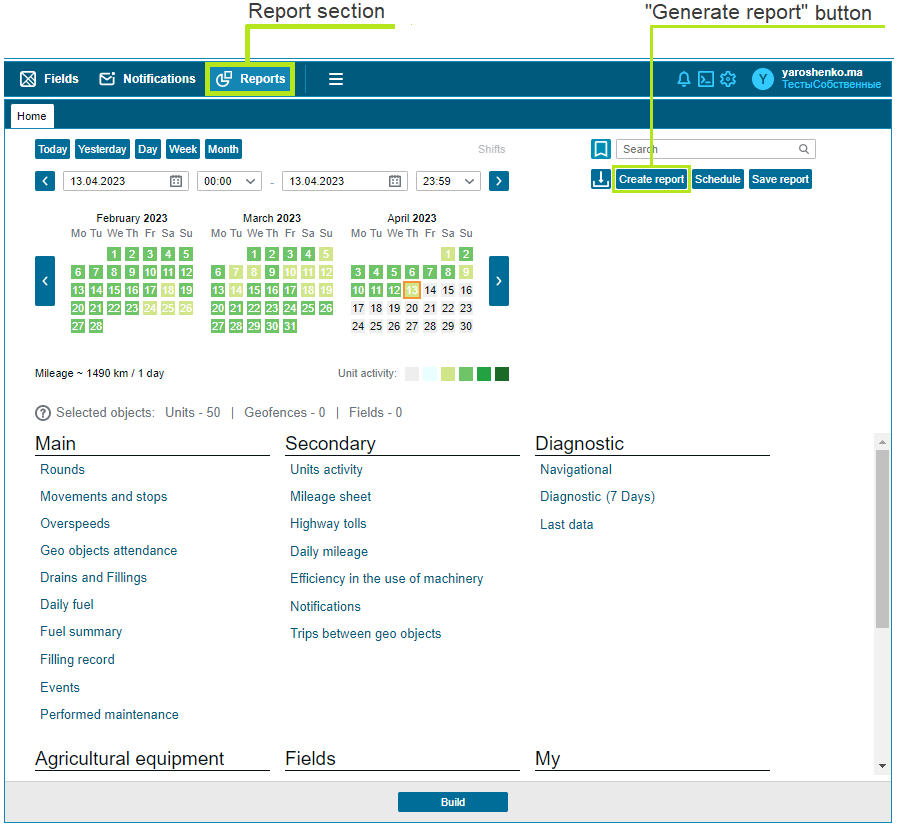
There are also forms for building ready-made reports, which are divided into “basic”, “additional”, “agro” and “mine” (created by the user using the report designer).
Report search is supported.
The "Show All" button will show all reports created by other users within the current tenant. Click the "Create Report" button and you will proceed to work with the "Report Designer" functionality.
Custom reports can be exported and imported. You can export a report by clicking on the export custom report icon.
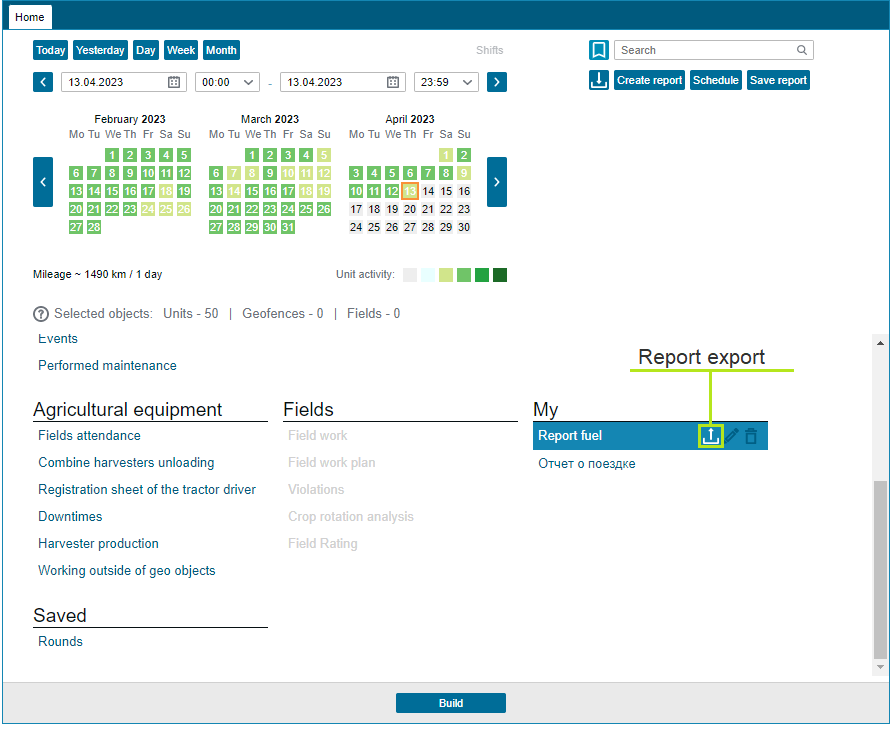
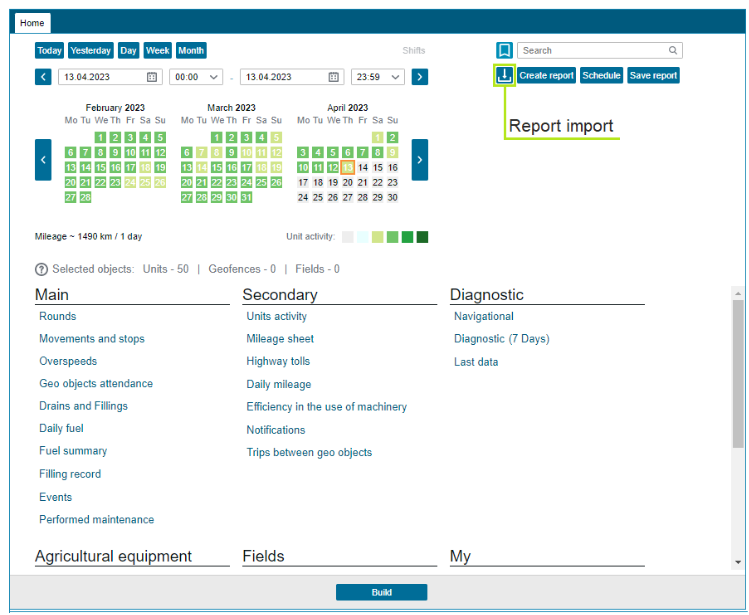
When exporting, a complete set of data about the created report is transferred: tables, graphs, display features in favorites and in monitoring. You can import a report by clicking on the custom report import icon.
Report Designer Features
The report builder allows you to assemble a custom report from data tables and graphs.
The constructor contains sets of ready-made tabular data for creating reports:
Drivers - includes data collected during the period of activity of the driver connected to the rfid tag.
Geo objects - includes data grouped around the concept of "geozone".
Sensors - used to analyze data from installed sensors.
Trips - used for general analysis of trip data.
Loss of communication - used to analyze the quality of communication and identify cases of sabotage.
Exceeding engine speed - used to find excess values of the sensor type Engine speed.
Exceeding speed - used to analyze the operation of equipment, taking into account the speed limit.
Reasons for downtime - includes the data of the recorded work in the Logistics module.
Drains and refills - used to control the fuel level in the tank and detect the facts of draining.
Events - displays the chronology of all events that occurred with the vehicle for the selected period of time. Also in the "Events" report, it is possible to filter records by the duration of events.
Parking — used to record stops and parking of equipment, their reasons and the time spent on them.
Fuel - used to generate detailed reports on fuel consumption.
Sensor trace - used to display data from sensors in the form of a table at specified intervals.
Photos - all photos uploaded by clients are displayed. Clicking on an image will open it for viewing.
The Preview tab shows how the rendered report will look.
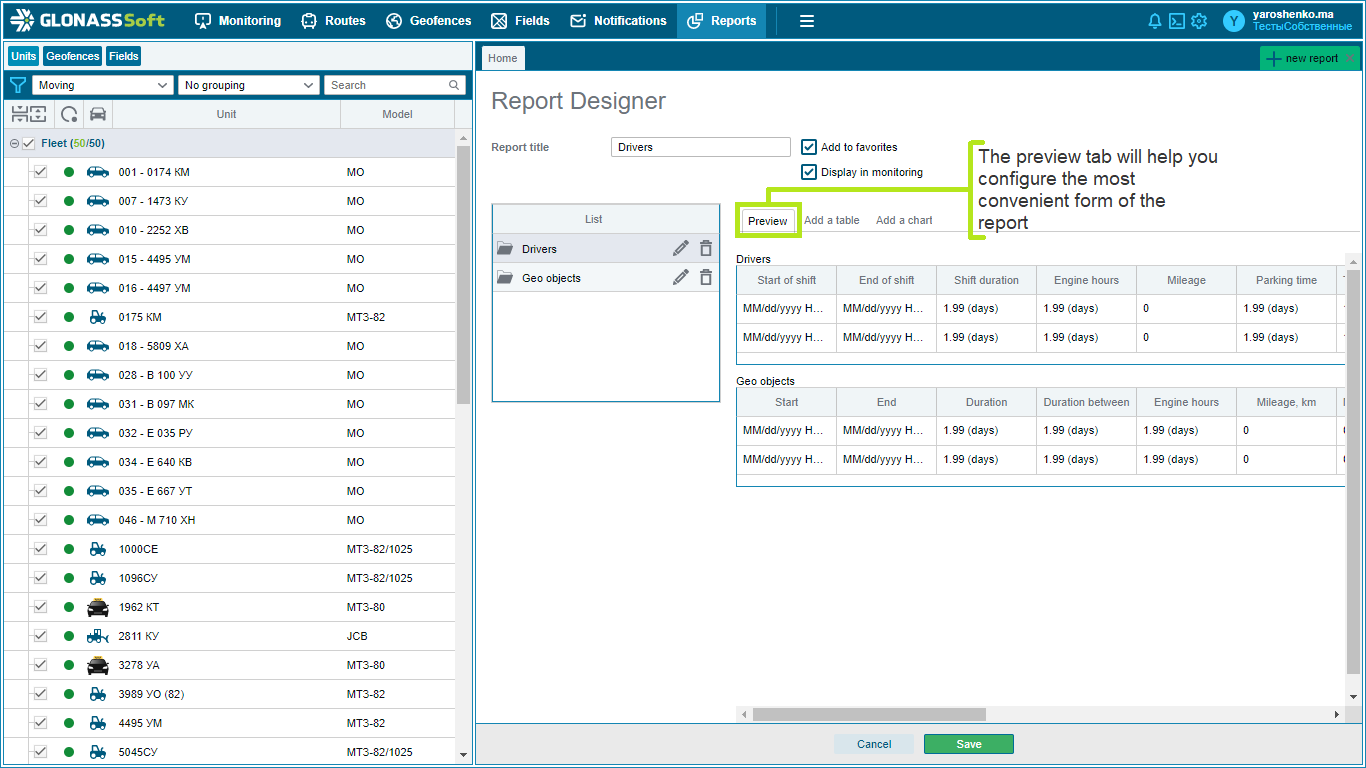
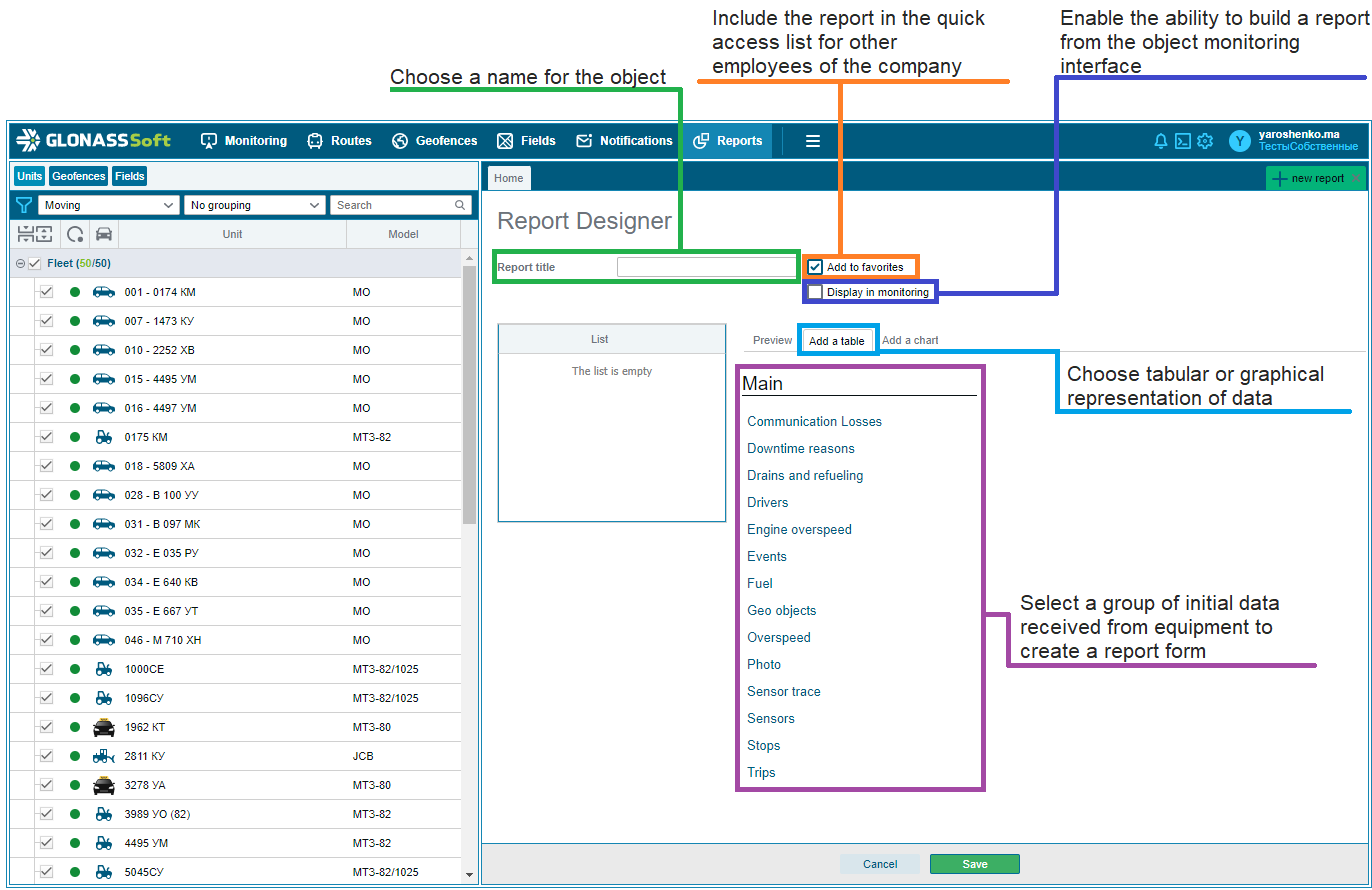
User reports are created on the basis of a wide range of ready-made tables and graphs, but since this information is often redundant, users can choose which and in what form they need tables and graphs for specific reports.
In the main window for creating and editing a report, you can:
Name or rename the report.
View a list of tables and graphs already added to the report, edit them, delete or add new ones.
Include the report in a quick access list available to other employees of the company.
Add the ability to apply a report from the "Transport Monitoring" functionality.
The created table or graph can be easily edited by clicking on the “pencil” icon in the “List” window, and they can also be removed from the report by clicking on the “recycle bin” icon in the same window.
Creating and editing tables
Here you can specify the fields that will be displayed in the report table by ticking them, for example, only the car number, driver, start and end addresses of the violation.
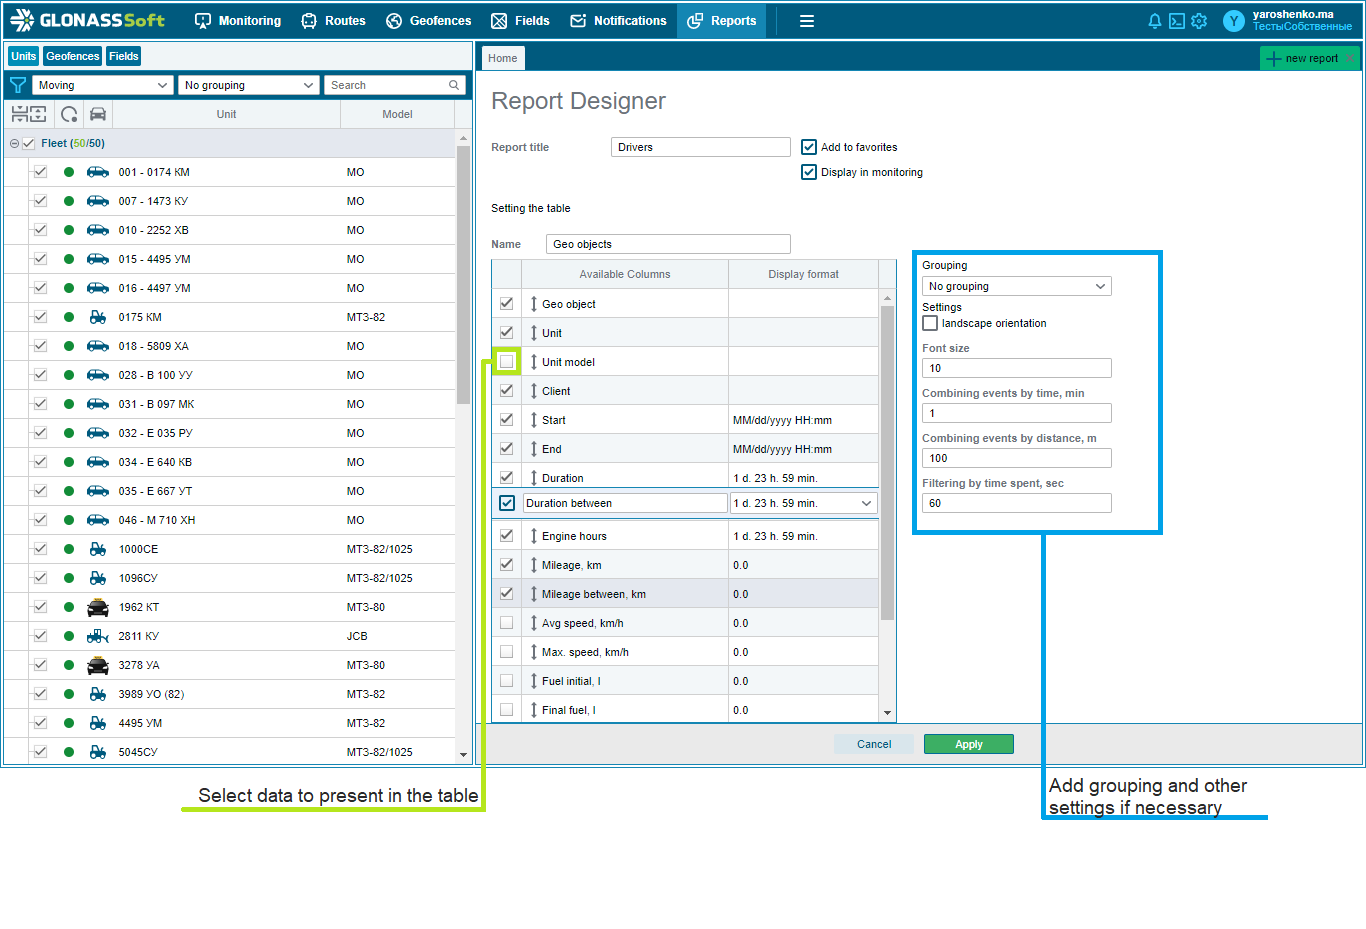
For each table, you can set an individual set of parameters. For example, for the "Exceeding the speed" table, you can set the speed value, the excess of which will be considered a violation, the duration of movement at this speed, etc. The data can be grouped according to a certain attribute and sorted.
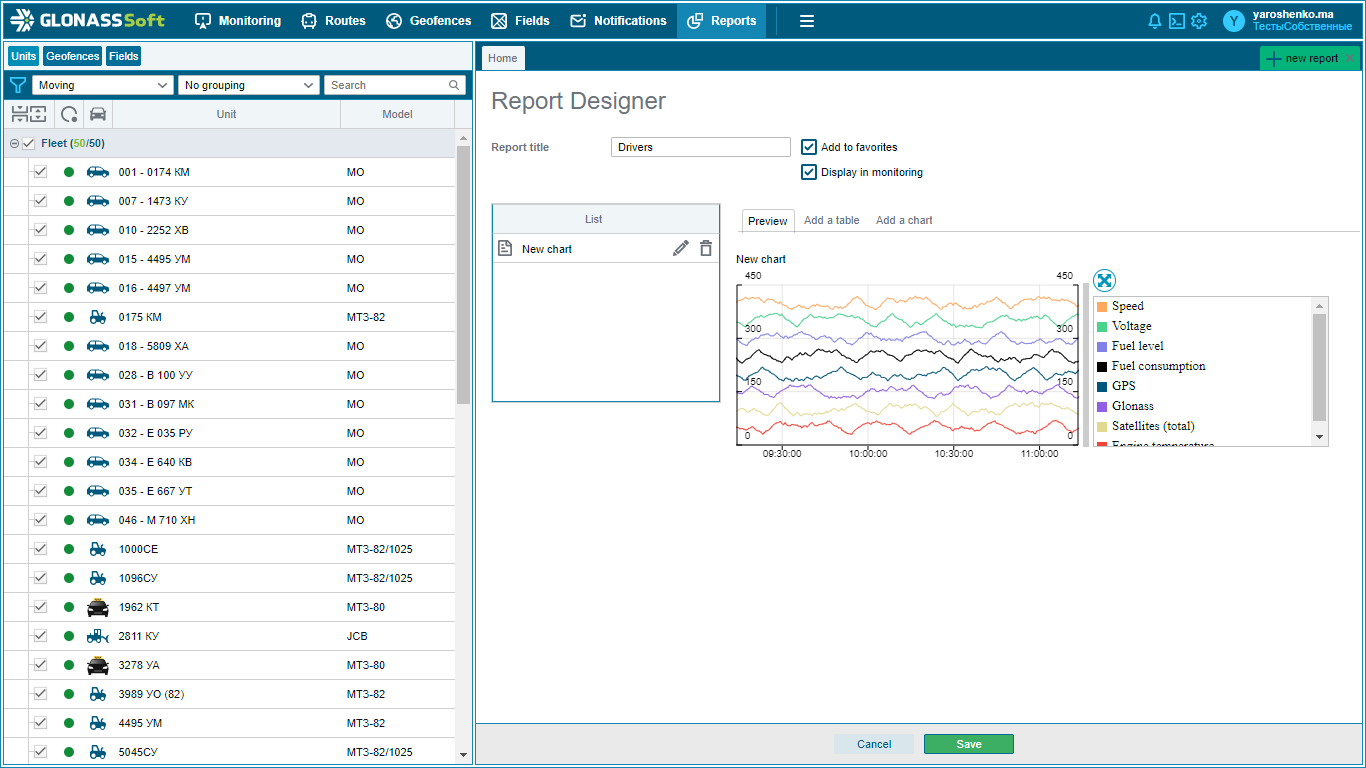
Creating and editing charts
Data can be added to or removed from the chart by checking the checkboxes.
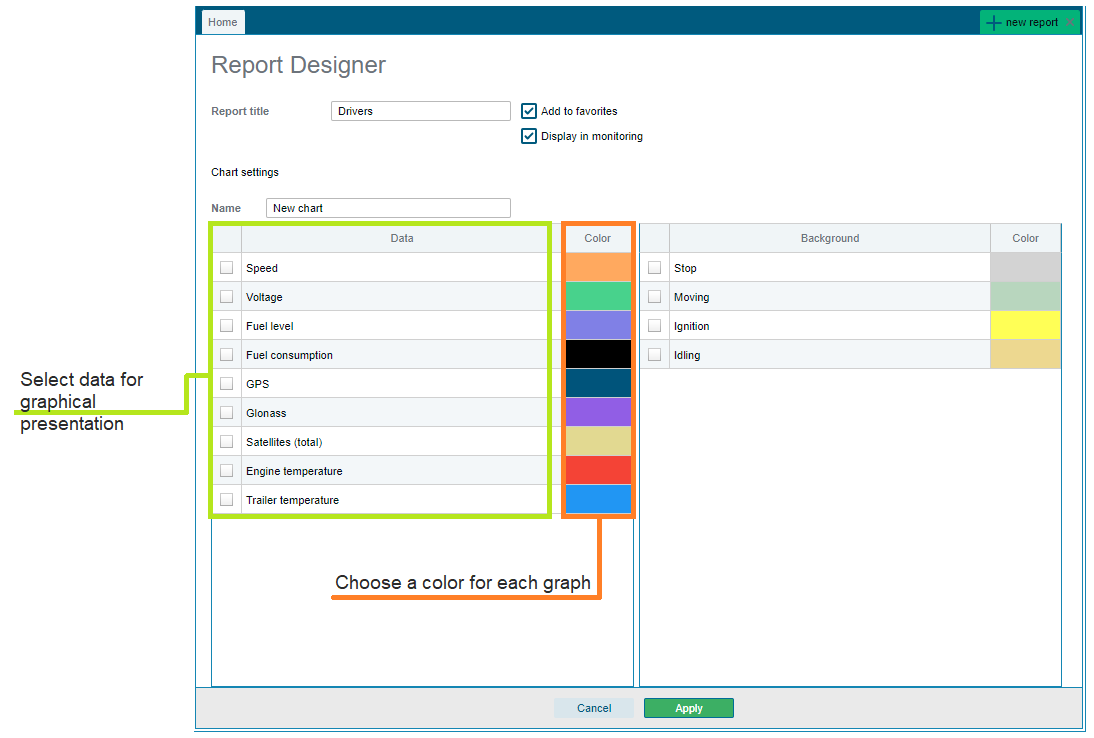
When plotting a graph, the user can choose the color for displaying certain indicators.
After editing the table or graph, you need to click the "Apply" button and they will be added to the report. Click "Back" if you decide not to add a table or graph.
The finished report is saved in the "My" report group and will be available at any time.