Agro reports
To build a report, you must perform the following sequence of actions:
Select objects for the report. Both vehicles and geo objects are available for selection. Report types differ for different types of objects. When selected, filtering, sorting and selection tools are available. The report object selection area contains vehicles or geoobjects that can be selected. Reports are built for the marked objects in the area for selecting report objects;
Select Reporting Period;
Select a report type.
Working outside of geo objects
Work outside of geoobjects means tracks of objects that satisfy the following conditions:
• Being outside geofences;
• Compliance with process speed range.
This report provides summary information on potential agricultural activities outside geoobjects.
Input parameters:
• Time range;
• List of objects (machines);
• Maximum technological speed;
• Maximum speed for each model (default);
• The same maximum speed for all.
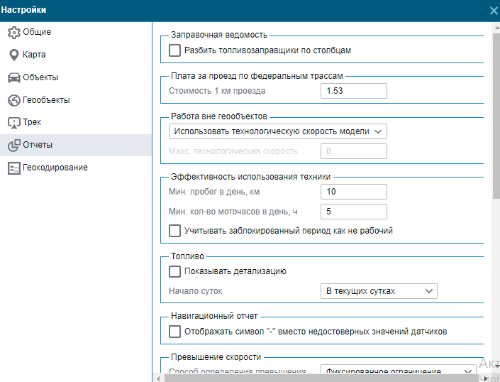
The parameter "Maximum technological speed" is set in the report settings. To do this, go to the settings and then to the reports section:
Report data when building:
• Object number;
• Model;
• Driver;
• Beginning of work;
• End of work;
• Duration;
• Mileage;
• Motor hours;
• Movement;
• Idling;
• Fuel.
Field work
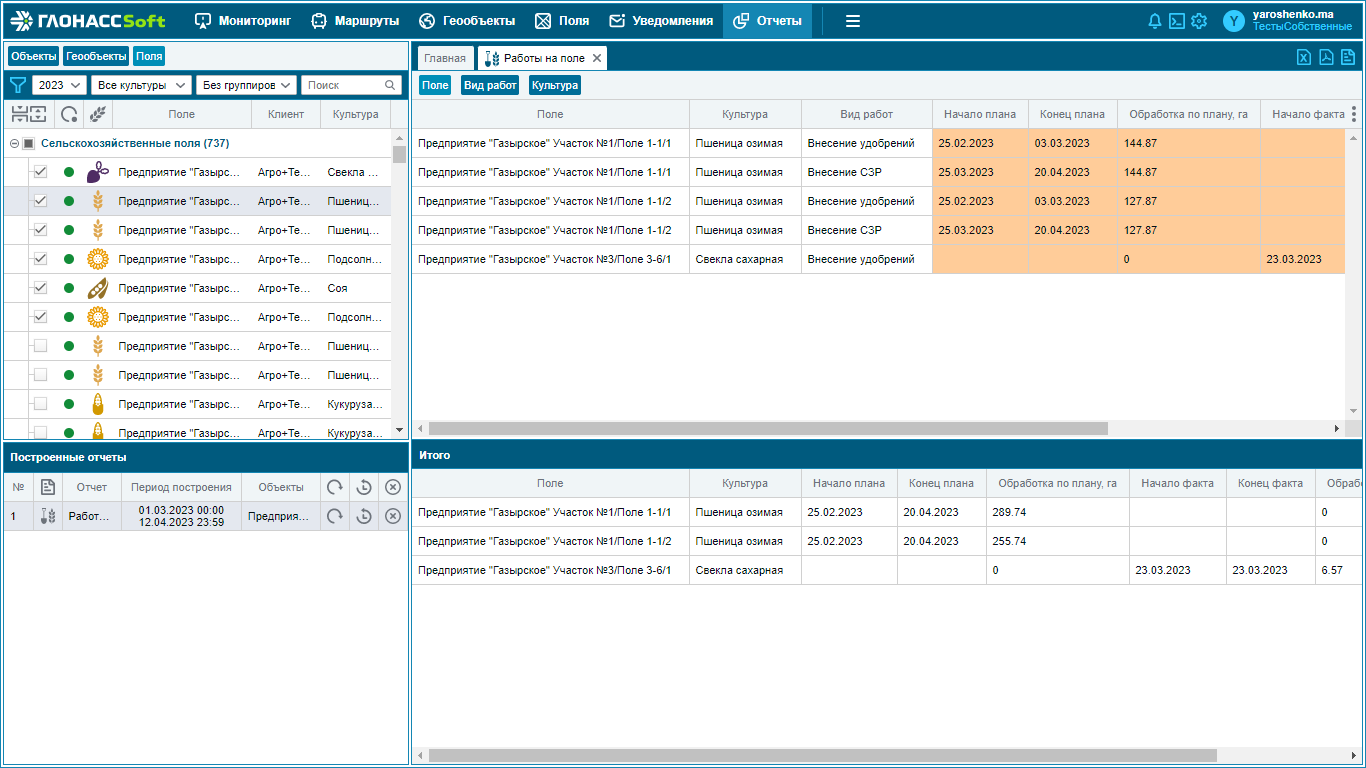
This report provides a summary of planned and actual work in the selected fields.
At the output, we get a list of types of work from the annual plan, grouped by Fields, supplemented by data from the Accounting for the fact.
Color signaling is performed in the following cases:
• Performance of work not according to plan;
• Negative deviation.
Input parameters:
• Time range;
• List of fields.
Report data:
• Field name;
• Culture;
• Type of work;
• Start of the type of work according to the plan;
• End of the type of work according to the plan;
• Plan area (in hectares);
• Start of the type of work after the fact;
• End of the type of work after the fact;
• Area in fact (in hectares);
• Deviation (in hectares).
You can output the results in the context:
• Fields;
• Types of work;
• Cultures.
Violations
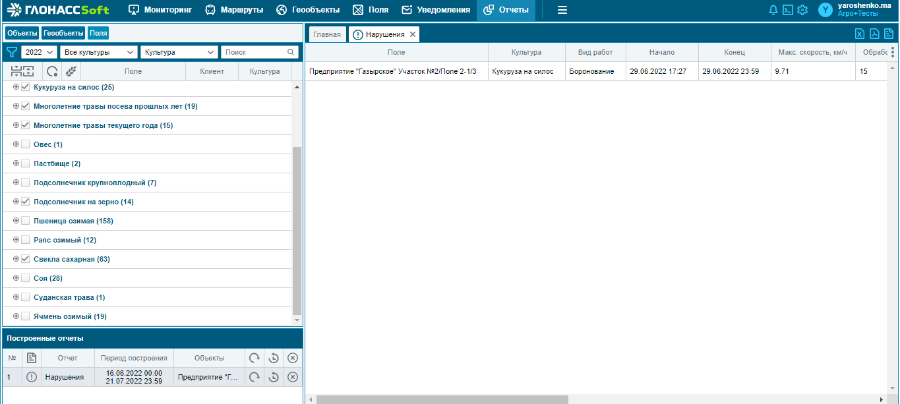
This report provides information on violations in the performance of agricultural work in the fields.
The area is calculated, which was processed with excess speed for each pair of Equipment-Unit from the fact.
We consider the entire area that did not fall into the fact as a processing skip. Double processing is calculated according to the algorithms for crossing tracks of equipment from the fact. For each pair of Equipment-Unit we take the norms for handling per shift and fuel consumption for this norm. We compare these data with the actual fuel consumption processed per hectare (“Production is less than the norm, ha”, “Fuel is above the norm, l”).
Input parameters:
• Time range;
• List of fields.
Report data:
• Field name;
• Culture;
• Type of work;
• Start;
• End;
• Processed, ha.;
• Maximum speed, km/h;
• Treated with excess speed, ha.;
• Pass, ha.;
• Double processing, ha.;
• Shift start, days;
• Shift end, days;
• Production less than the norm, ha.;
• Fuel over the norm, l.
Efficiency in the use of technology
This report provides information on the efficiency of equipment objects for the selected period. The criterion for the effectiveness of the use of equipment is the ratio of the number of days in the operation of the equipment to the number of days of the selected construction period.
A day is considered in service if two conditions are met:
1. Daily mileage is greater than the minimum daily mileage.
2. Hours per day are greater than the minimum number of hours per day.
Input parameters:
• Time range;
• List of equipment objects;
• Minimum mileage per day, km;
• Minimum number of engine hours per day, h.
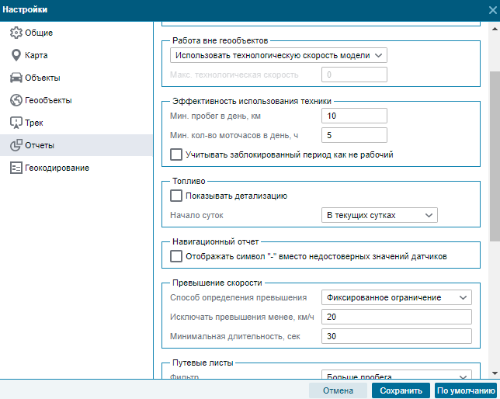
The parameters of the minimum mileage per day and the minimum number of hours per day are set in the report settings.
Report data:
• Object number;
• Model;
• Driver;
• In operation, days;
• Mileage;
• Motor hours;
• Movement;
• Idling;
• Utilization factor.
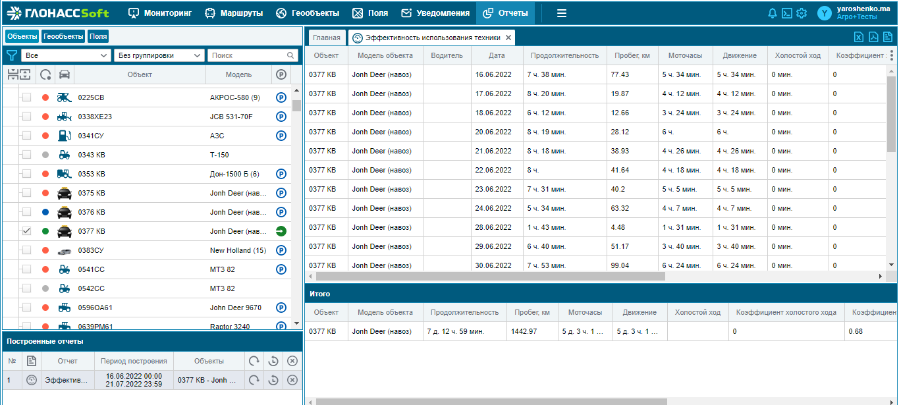
If the utilization factor does not exceed the value of 0.5, then the corresponding cell is highlighted in red.
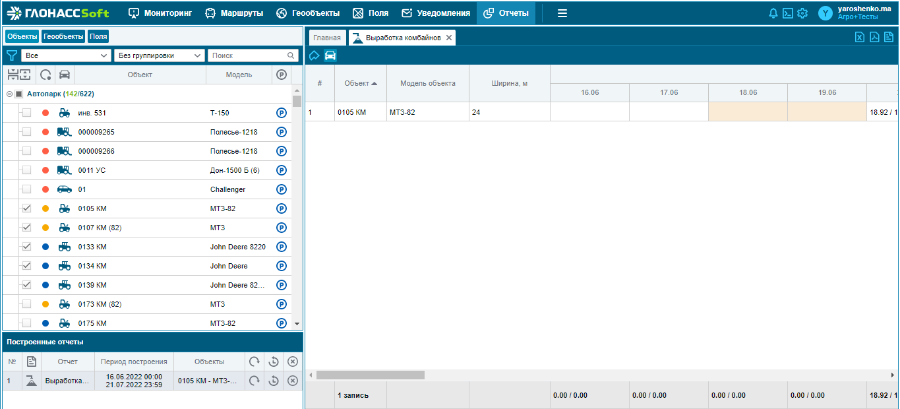
Combine harvester output
This report calculates the processing area of visited fields by day. When calculating the worked area, the width and technological speeds of the vehicle model are taken into account. The final values of the areas are calculated taking into account the intersections of the vehicle tracks. Conventional designations are used: Sobr - processing area, SVbr - processing area, taking into account technological speeds.
Combine identification.
The system itself determines the harvesters among the client's fleet. A sign of a combine is an indication in the model settings that the model contains a built-in unit for technological speeds.
Input parameters:
• Time range;
• List of objects.
Report data:
• Object number;
• Model;
• Width, m.;
• Processing area, Sobr/SVbr, ha.;
• Results.
Data can be presented relative to a field or relative to an object.
Crop rotation analysis
The report is presented in tabular form. Displays data about the crops that were grown in the fields for the selected time period. Report input data:
1. Field identifiers.
Report data:
• Subdivision;
• Field;
• Cultivated area;
• Crop years.
Crop years are displayed when the rotation is complete.
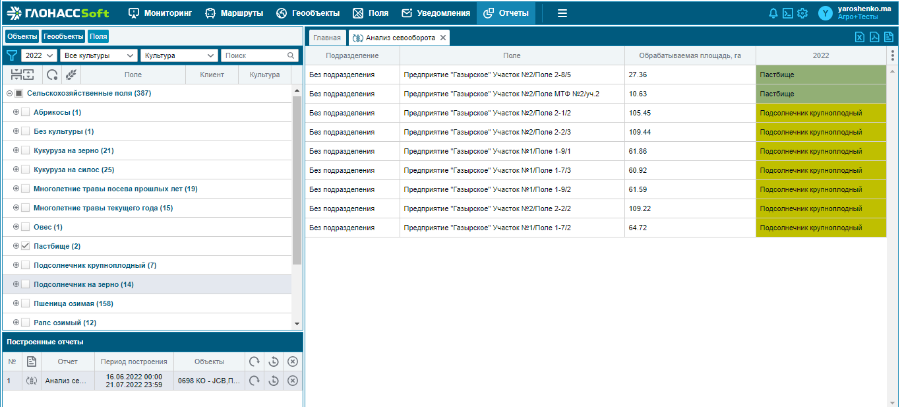
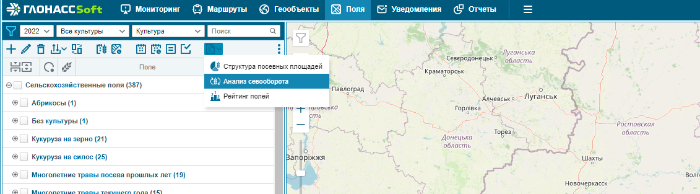
The report can be built from the menu above the map. It is built for the fields selected by checks in the field tree.
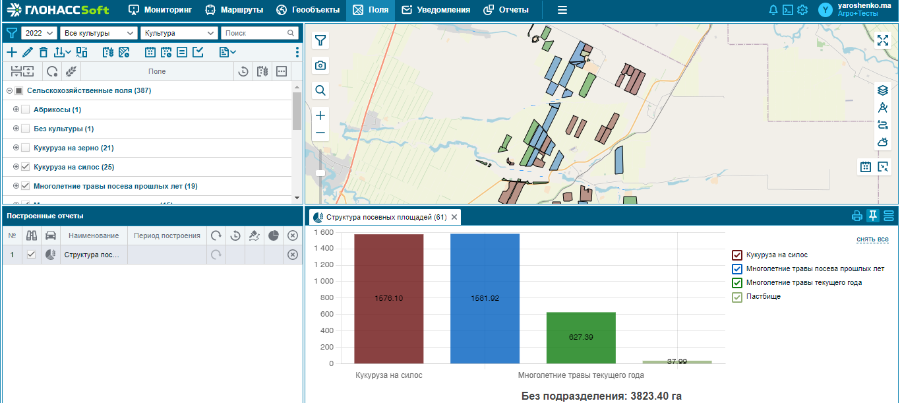
Crop area structure
Input data:
• Field identifiers.
Report data:
• Diagrams.
The report is built from the menu above the map. To do this, you first need to select fields in the field tree with checks.
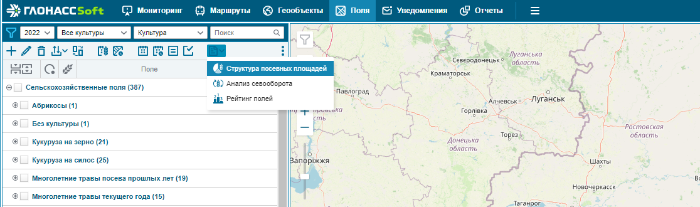
This is an interactive report that provides information on the number and area of fields. In the bar chart, the fields are divided into groups by crops with the corresponding color scheme.
Field work plan
An interactive report that displays annual planning activities with
canceled, operational planning, tasks for machine operators, technological maps and records of the facts of the selected fields. The information is presented in the form of a Gantt chart.
Report input data:
• Field identifiers.
Output:
• Gantt chart.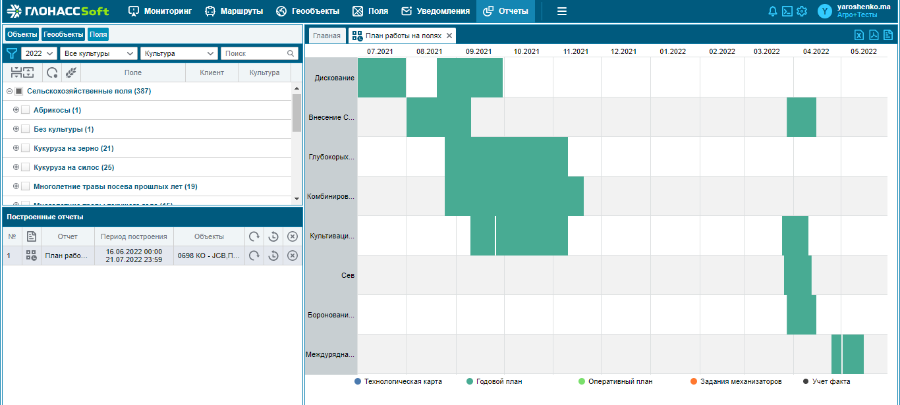
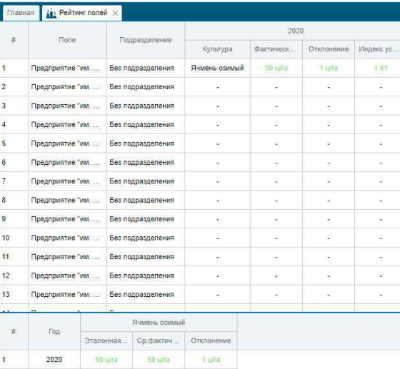
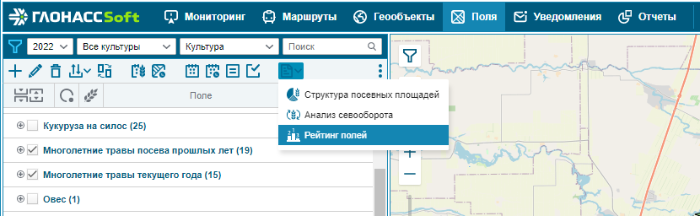
Field Rating
A tabular report that is built on the basis of data on cultivated crops in the field. The data is taken from the crop rotation of the field and the actual yield indicators. The report includes information for all crop years of the selected period.
Report input data:
• Field identifiers;
• Reporting period.
Report output:
• Field;
• Subdivision;
• Year;
• Culture;
• Actual yield;
• Deviation (actual yield from planned);
• Index of success.
The color of the rows in the report depends on the actual yield in the field:
• Red - actual yield is less than average crop yield.
• Orange - actual yield is above average, but less than 110% of average.
• Green - the actual yield is greater than 110% of the average.
The report can be built from the menu above the map. It is built for the fields selected by checks in the field tree:
Downtime
The report displays information about downtime of objects that last more than 60 minutes. Report data is broken down by day (this is called changing report terms). Within a day, a list of stops is formed, which can be both inside geo objects and outside.
Report input data:
• Object identifiers;
• Request period.
Report output:
• Object number;
• Change;
• Downtime (stop period);
• Downtime duration and location (total downtime);
• Idle time XX and location (duration of idling during stop);
• Lane number (the lane number increases after the geo object stops).
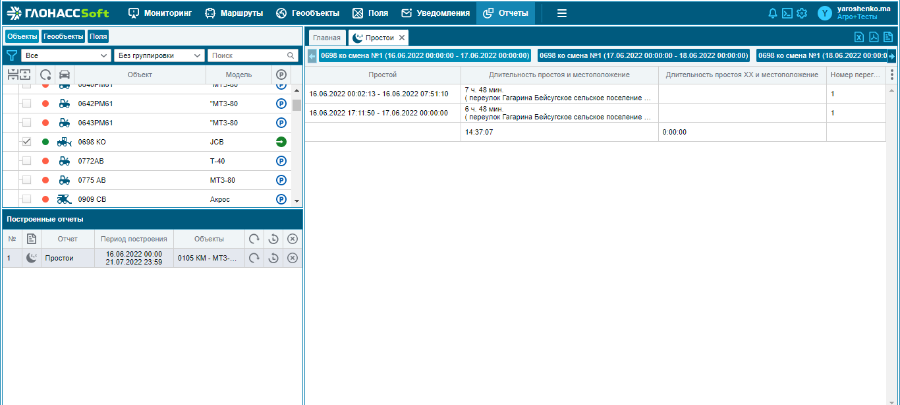
Excel and PDF export forms are available for the report
Register of grain unloading
The tabular report displays the unloading data that comes from the Unloading sensor. The widest application of the report is in AgroTechnology, when combines unload grain from the bunker during the harvesting of the field.
Report input data:
• Object identifiers;
• Request period.
Report output:
• Object number;
• Driver;
• Field;
• Event;
• Cars nearby (maybe several at the same time);
• Start;
• End;
• Duration;
• Productivity;
• Bunker mass;
• Cultivated area, ha.;
• Address.
Export report forms are available in Excel and PDF.