Track
Track
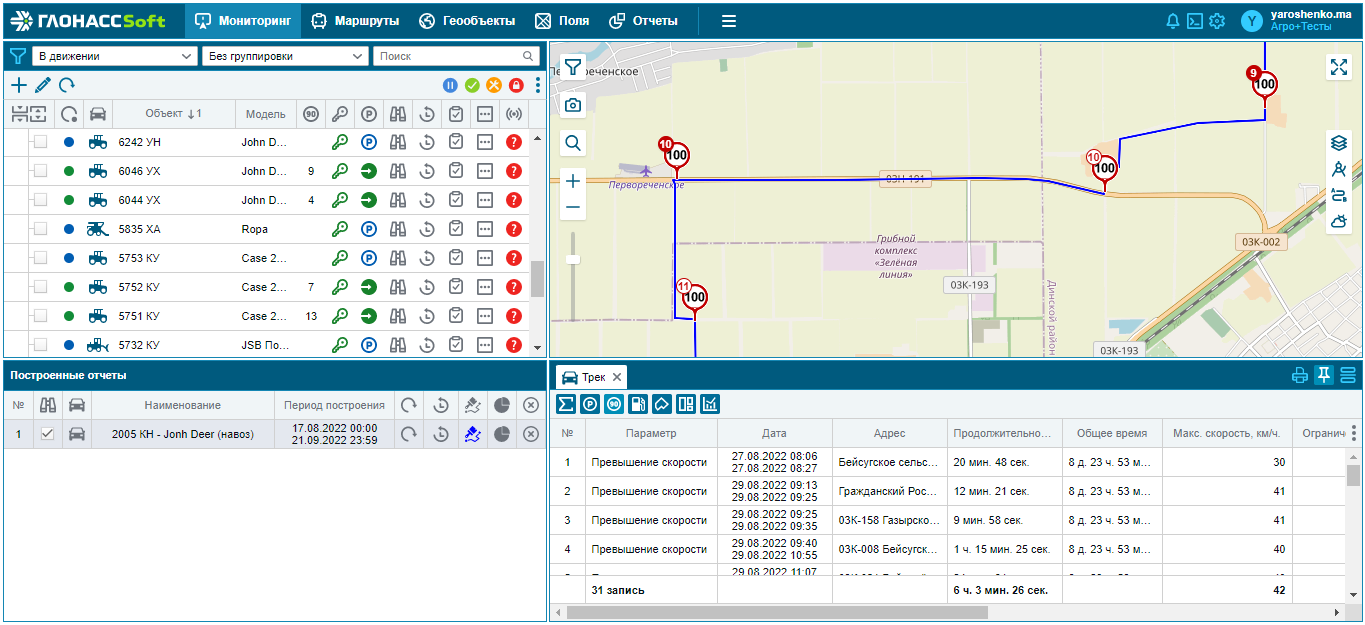
A track is a curve of movement of an object on a map. It is built by points with coordinates that come from the terminal installed on the object to the server. The monitoring system connects these points into a single line. The track can be marked with marks indicating the places of important events, such as stops, refueling, speeding and others.
Any number of tracks on one or several objects for different periods of time can be plotted on the map at the same time. So that the tracks do not visually merge, they can be painted in different colors. With a separate setting, you can color certain sections of the track in different colors (for example, depending on the speed of the object).
If the track takes a long time to build, then you have specified too much time or the Internet access channel is limited in speed.
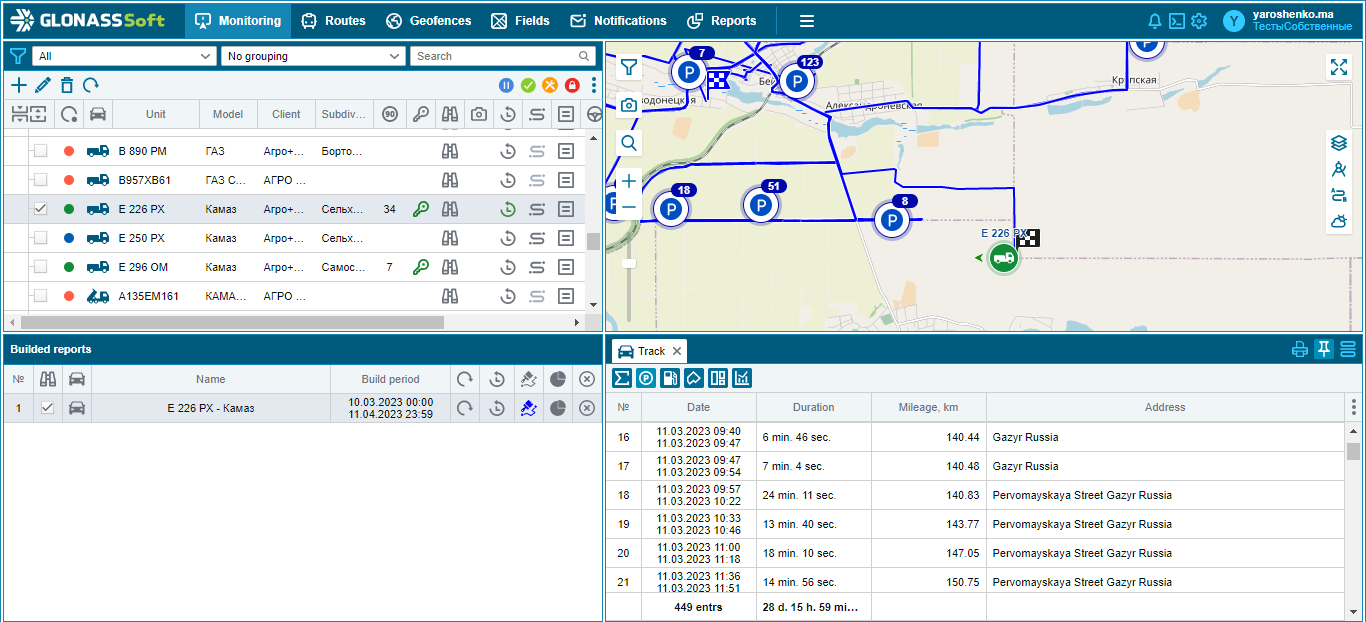
The generated reports window is inextricably linked with the track and describes the events reflected on the track. To enable the display of the track on the map, you must enable the track visibility mark on the map.
The calculation of the data in the table occurs for those periods of time when the movement of the vehicle is detected or the ignition sensor is active, if any.
If the object was not moving during the specified period, the track will not be built on the map, but a report with zero mileage will be generated in the report window.
To build a track, you need to select the appropriate object
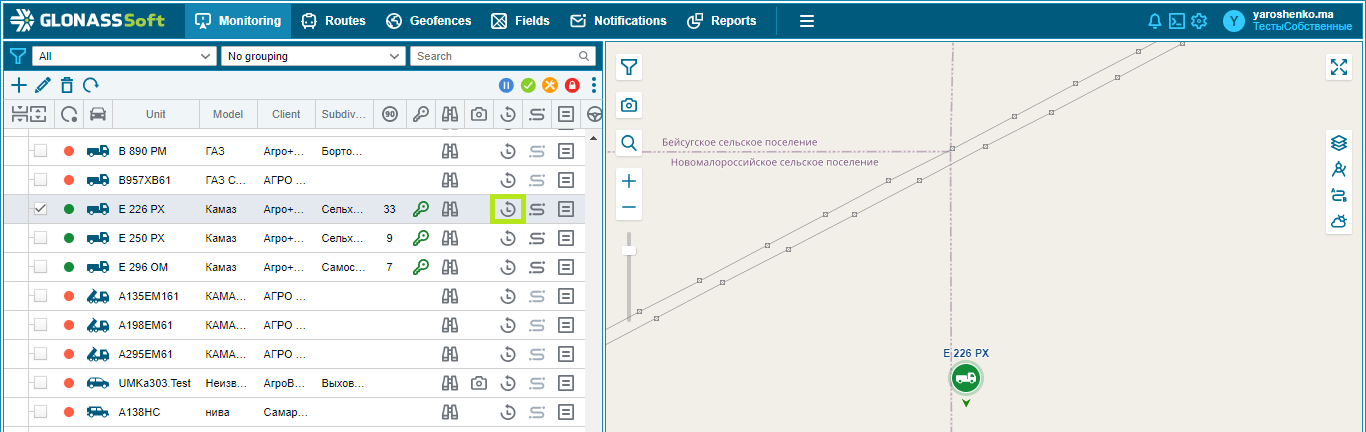
Click the "Build Story" button
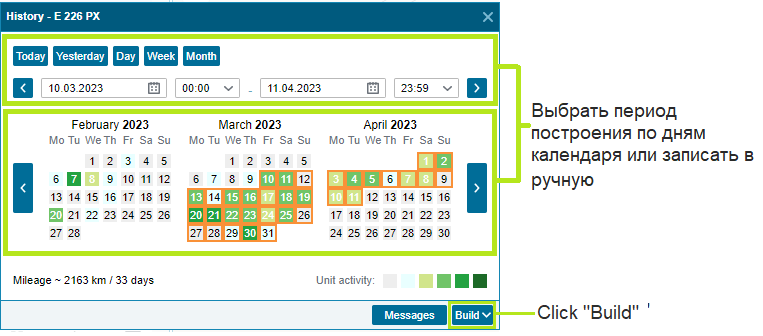
In the window that appears, specify the period of interest and click the "Build" button.
 - Days of activity of the object are colored green. The brighter the color, the more trips that day.
When plotted, the track will show summary information on the object for the period
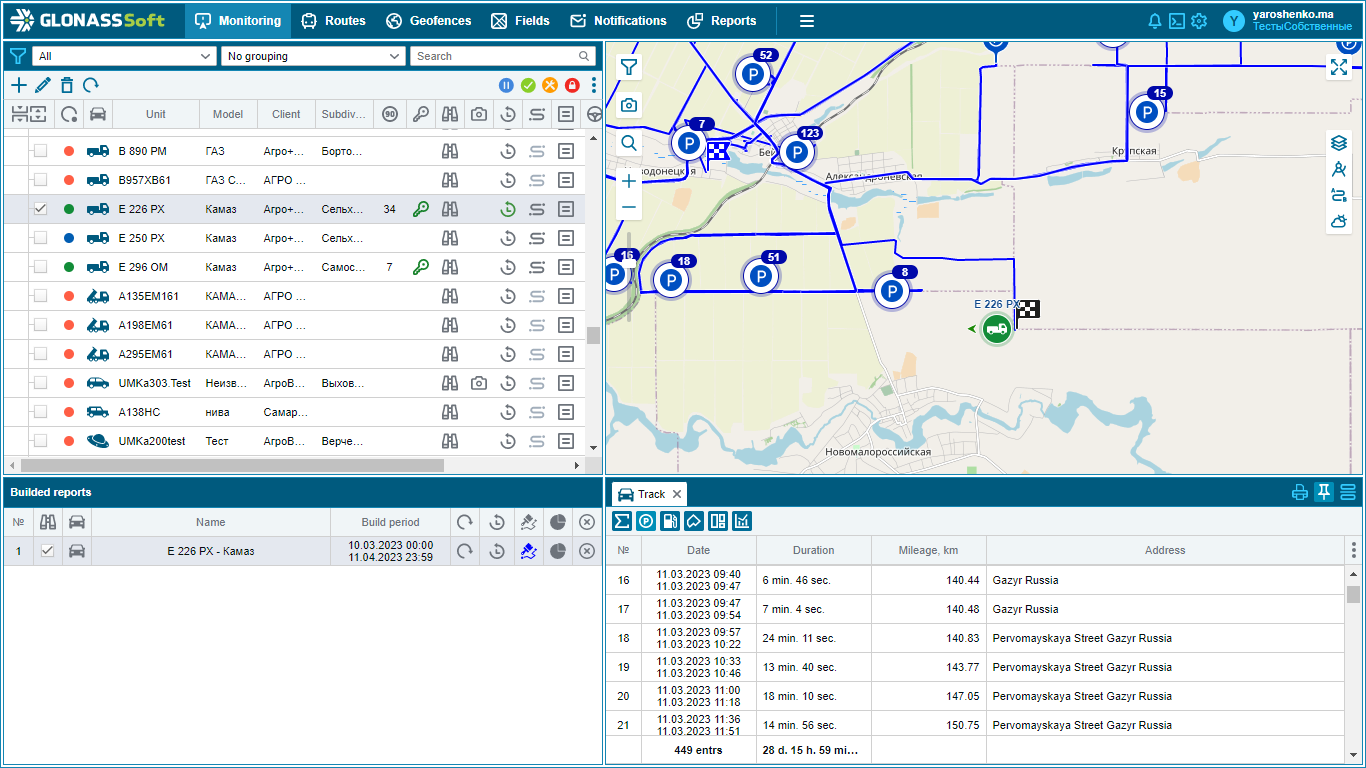
Other track analysis icons will also be available in the toolbar:
 - a table of summary information on the vehicle;
 - parking/stops;
 - speed control;
 - drivers;
 - routes;
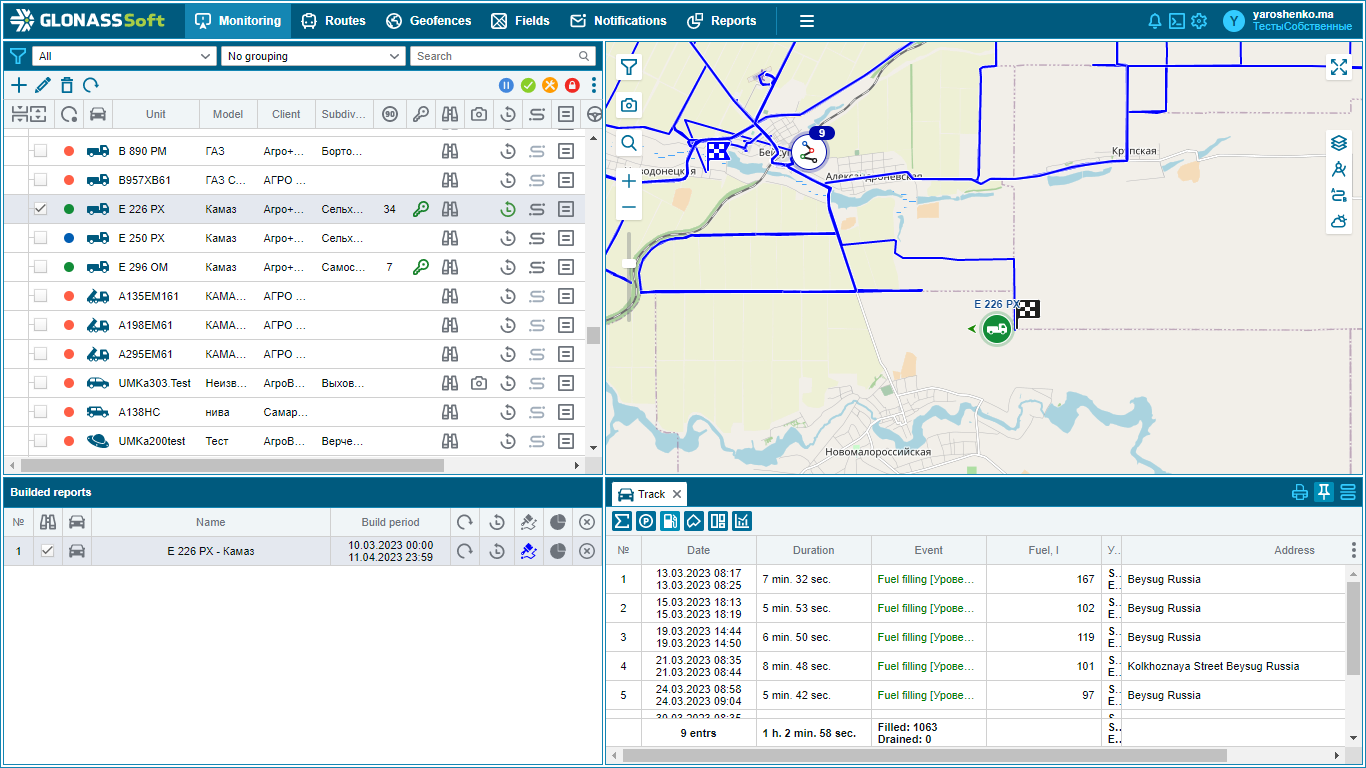
 - refills / drains;
 - filling/unloading tanks;
 - fuel distribution;
 - object schedule;
 - payload schedule (used for USS);
 - triggering of the sensor (arbitrary);
 - garbage pickup
 - time of connection of trailers or units to the object (RFID-identification);
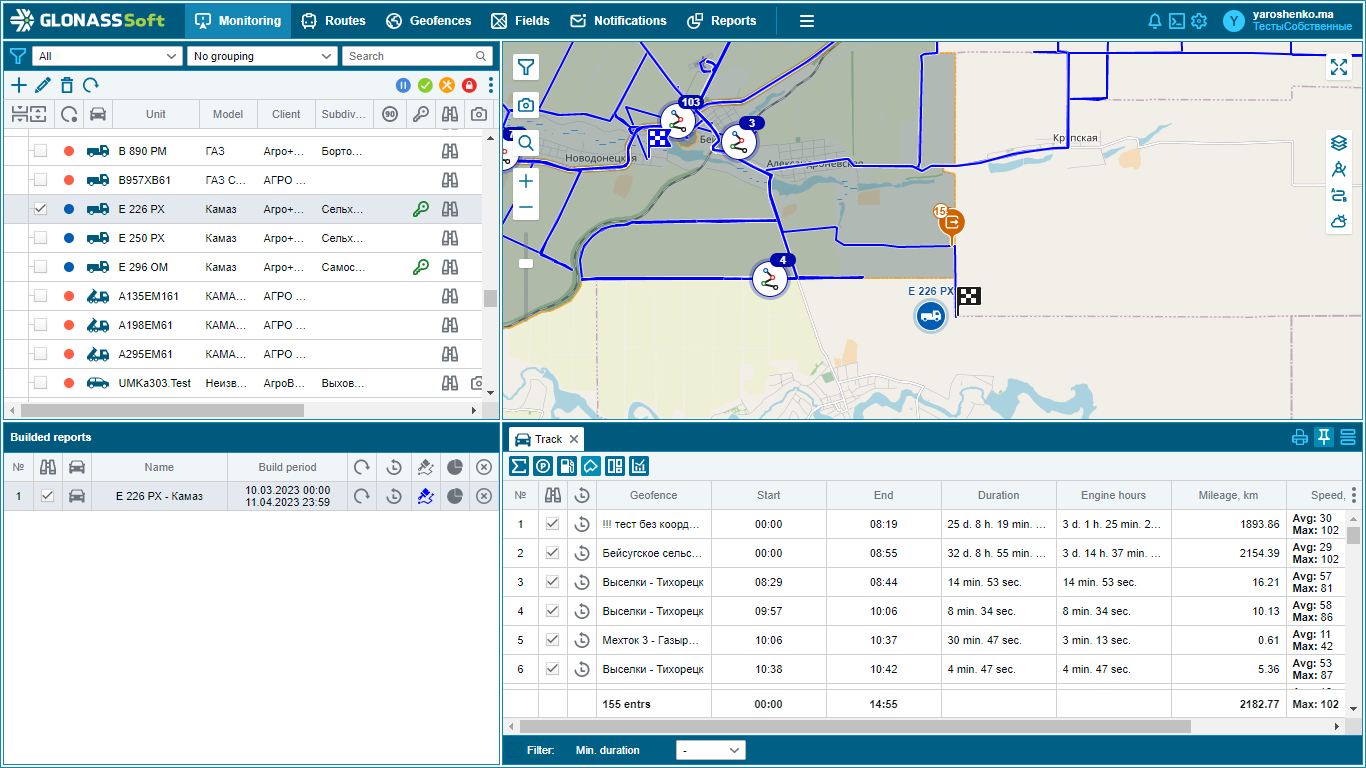
 - entrances/exits in geoobjects;
 - entries/exits in the fields (for the Agrotechnology 2.0 module);
 - weighing;
 - plumb.
- The presence or absence of any analysis icon on the data display panel depends on the equipment installed at the facility and the settings of this equipment.
Also available are the following fields, which will show all the necessary information:
- Date - the date for which the calculation was made is displayed;
- Duration - displays the duration of trips;
- Mileage, km - mileage for the weight of the trip is displayed;
- Engine hours - displays the values of accumulated engine hours in motion and at idle;
- Time - displays the time in motion and in the parking lot;
- Speed, km/h - displays the average speed for all trips and the maximum speed;
- Fuel, l - displays the fuel level at the beginning and at the end of the day;
- Consumption, l - displays the total fuel consumption per day;
- Consumption, l / 100km - fuel consumption per 100 km of run is displayed;
- Consumption, l/h - displays fuel consumption relative to the duration of trips;
- Address - displays the address of the object at the beginning of the day and at the end of the day;
Using the tabs, you can quickly get reports on individual events, such as:
Stops
Speed violations
Refueling or Draining fuel
Entrances or exits from geo objects
When you click the left mouse button on the track event icon, a tooltip appears, which displays data on the time / duration of the event, the position of the object at the time of the event, the distance traveled to the point of the event and the start time of the event.
- When a certain data line is selected in the table, the event corresponding to this data line is highlighted on the track brighter, and the rest become pale.
Track coloring
The track color can be set individually so as not to confuse the tracks of several objects.
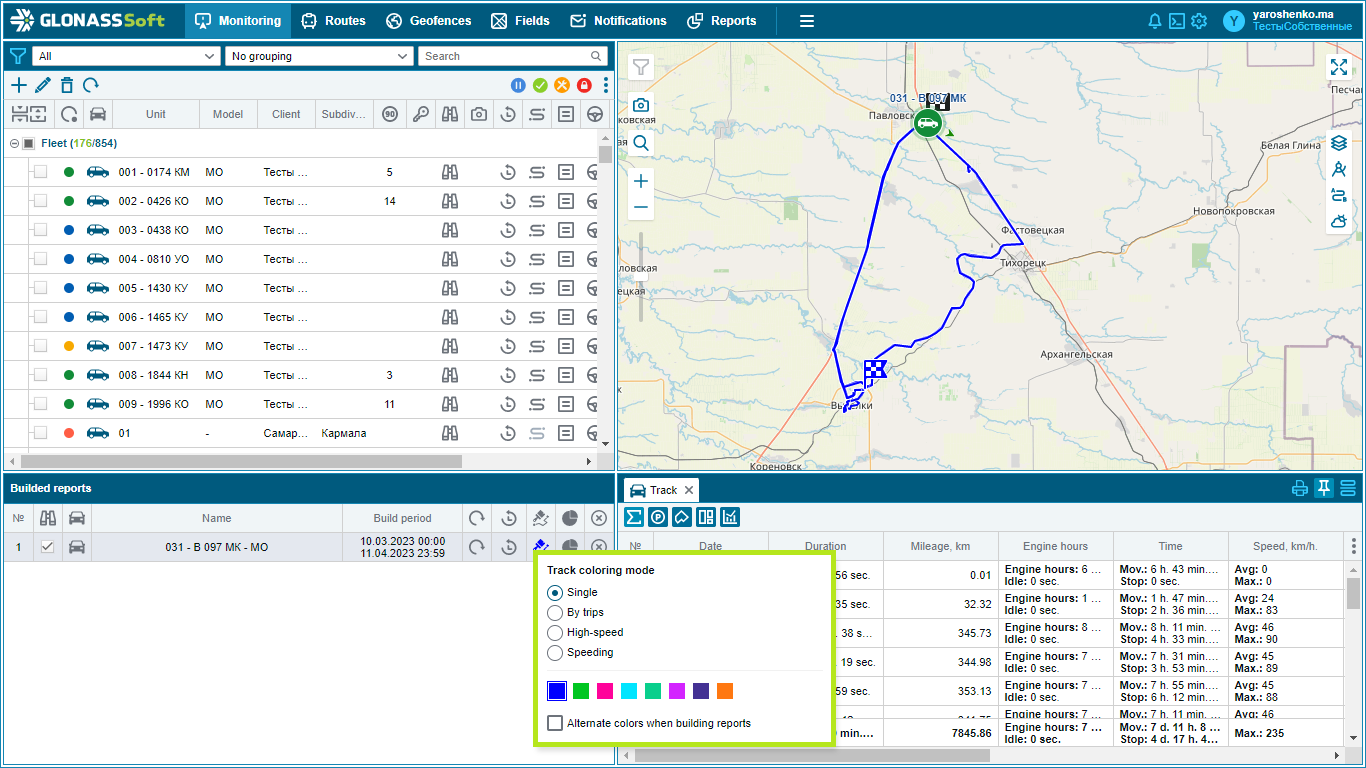
You can also set the speed coloring of the track, which shows the intensity of movement.
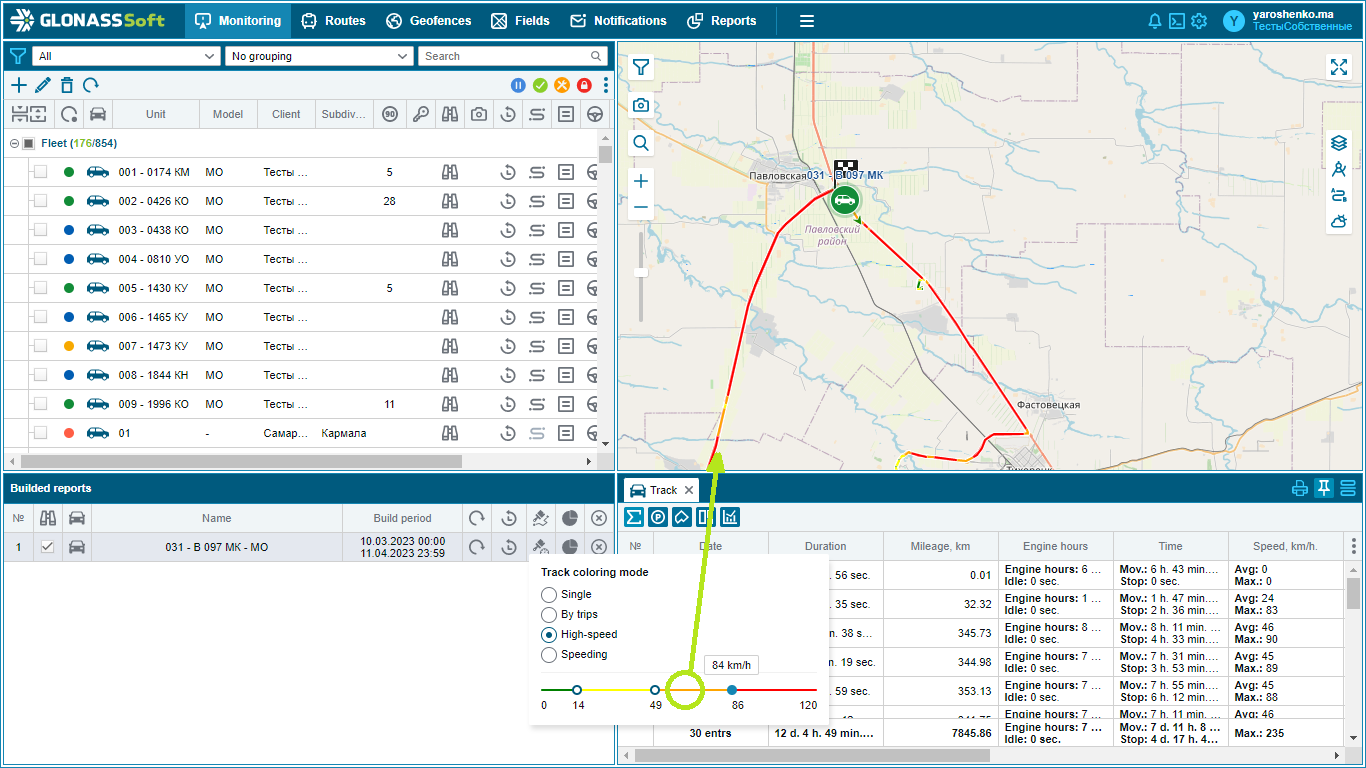
When coloring a track, it is possible to change the speed ranges corresponding to certain colors. These settings are stored in the system for those objects on which they were replaced.
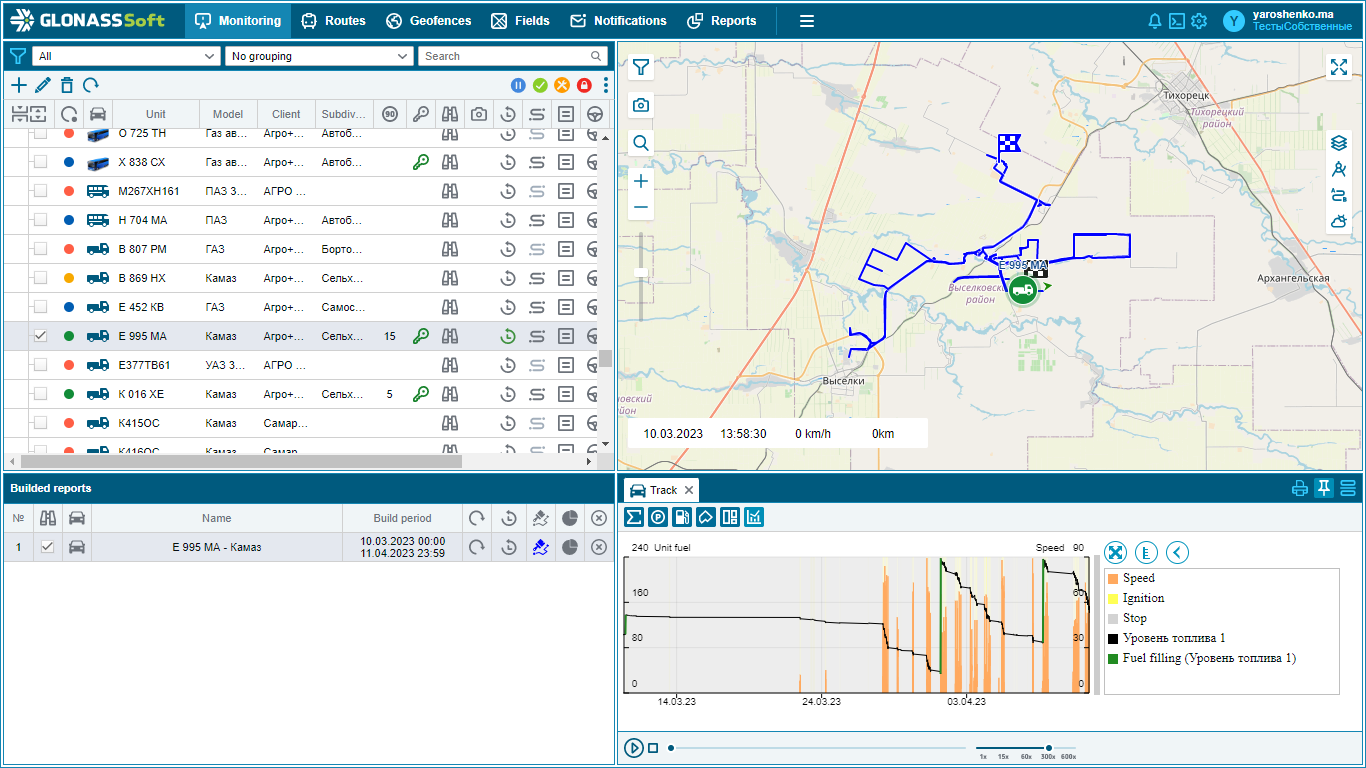
Track player
For the convenience of viewing the track and finding the correspondence between time and events, the monitoring system provides the Track Player tool. The player becomes available when you switch the data type to Object Graph. At the same time, the graph of the object appears in the table with its own accuracy settings (with accurate display, the graph takes the form of a polyline, with a smoothed image, it looks like a smooth curve).
When the graph is played in the table, the track of events on the map is also played. Also for the chart, there is a setting for the color scheme of the event track for various types of events.
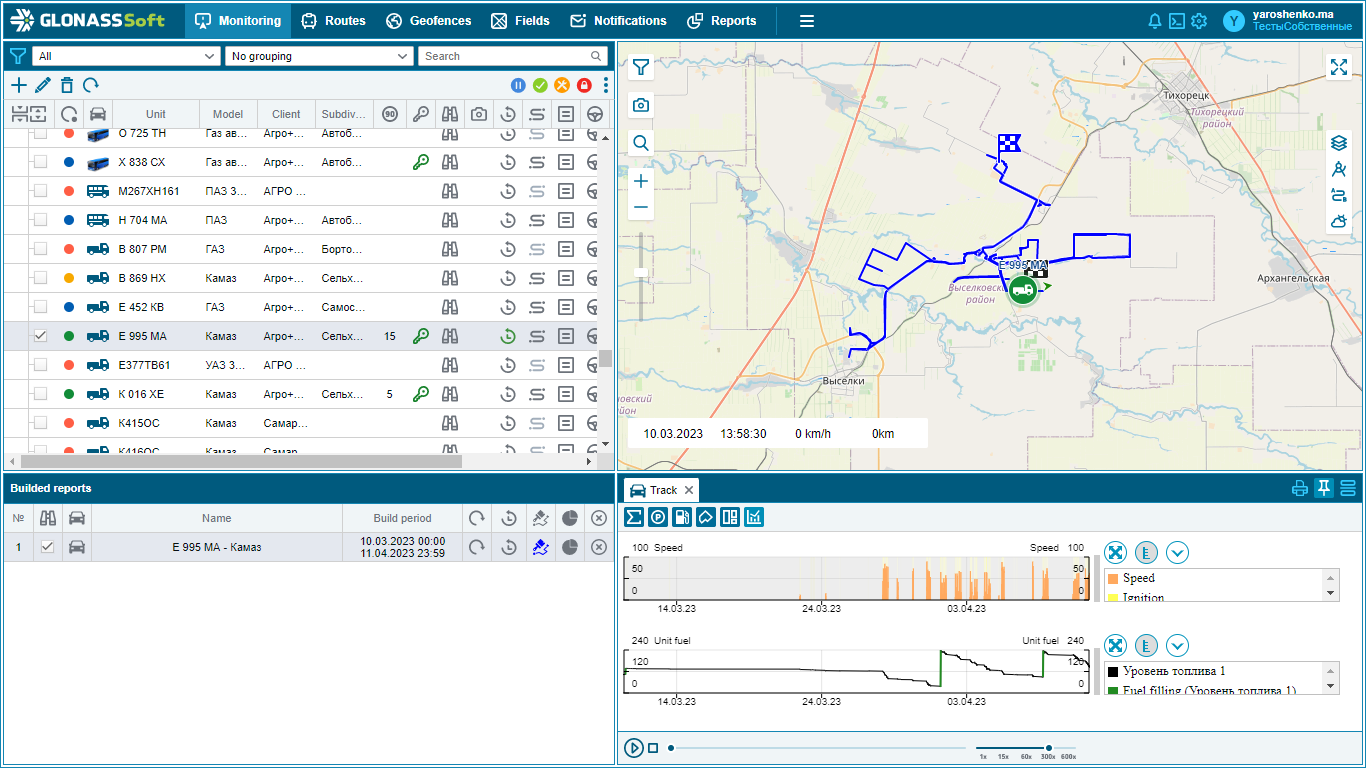
The chart can be split or grouped.
Print form setup
You can create and customize the printable form of the Track report. To do this, click the  Print form settings button , a window will open in which you can select the tabs that you want to print.
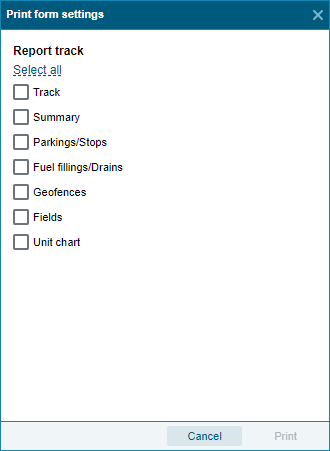
In the window, you can select both all items at once, using the Select all button , or individually.