Messages
Last modified by Андрей Калиновский on 2023/04/25 11:10
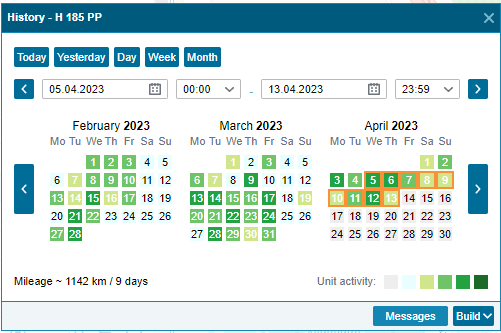
This report provides an opportunity to view all messages received from the object, such as coordinates, parameters, speed, data from sensors, etc. In order to build a “Messages” report, you need to select the required one in the object tree and click on the “Build history” button - 
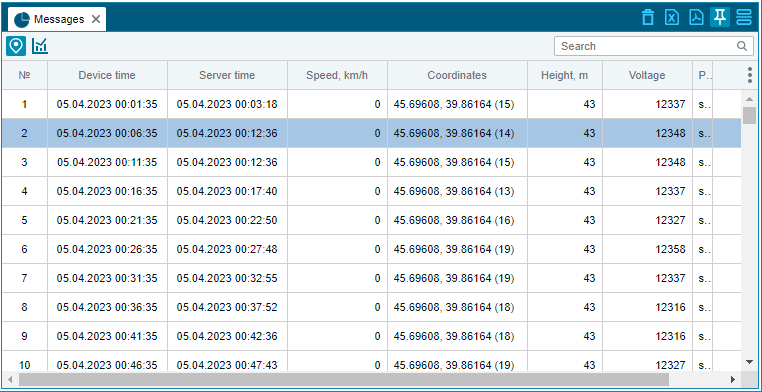
The report table contains the following information:
- Device time - the time when the message was generated on the terminal.
- Server time - the time the message arrived at the server. If there is a big difference between device time and server time, the message will be colored blue.
- Speed km/h - the speed of the object transmitted by the terminal in the message.
- Coordinates - coordinates of the object transmitted by the terminal in the message.
- Altitude, m - the height at which the terminal was located from sea level.
- Voltage - voltage applied to terminal inputs.
- Parameters - a list of additional parameters transmitted in the message is displayed here. These can be parameters from the can-bus, odometer and various other sensors.
- Photo - this column is available if you have the right to work with photos and on the condition that the terminal of the object transmits a photo. When you switch to the window for working with photos, all photos generated during the report period will be available.
It is also possible to delete selected messages using the button:
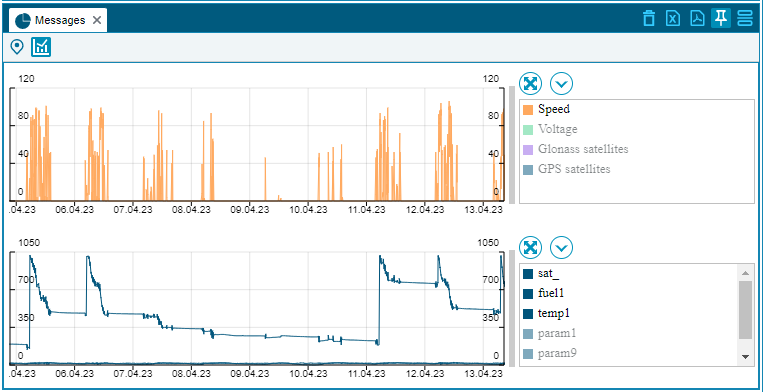
In addition to the tabular display, the data is also presented in the form of a graph:
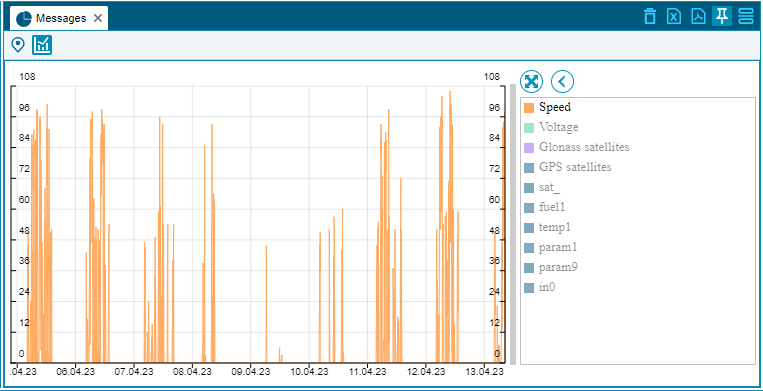
The data displayed on the graph can be grouped, separating the main data from the sensor readings: