Building reports
Building reports
Reports are used to control various indicators received from monitoring objects.
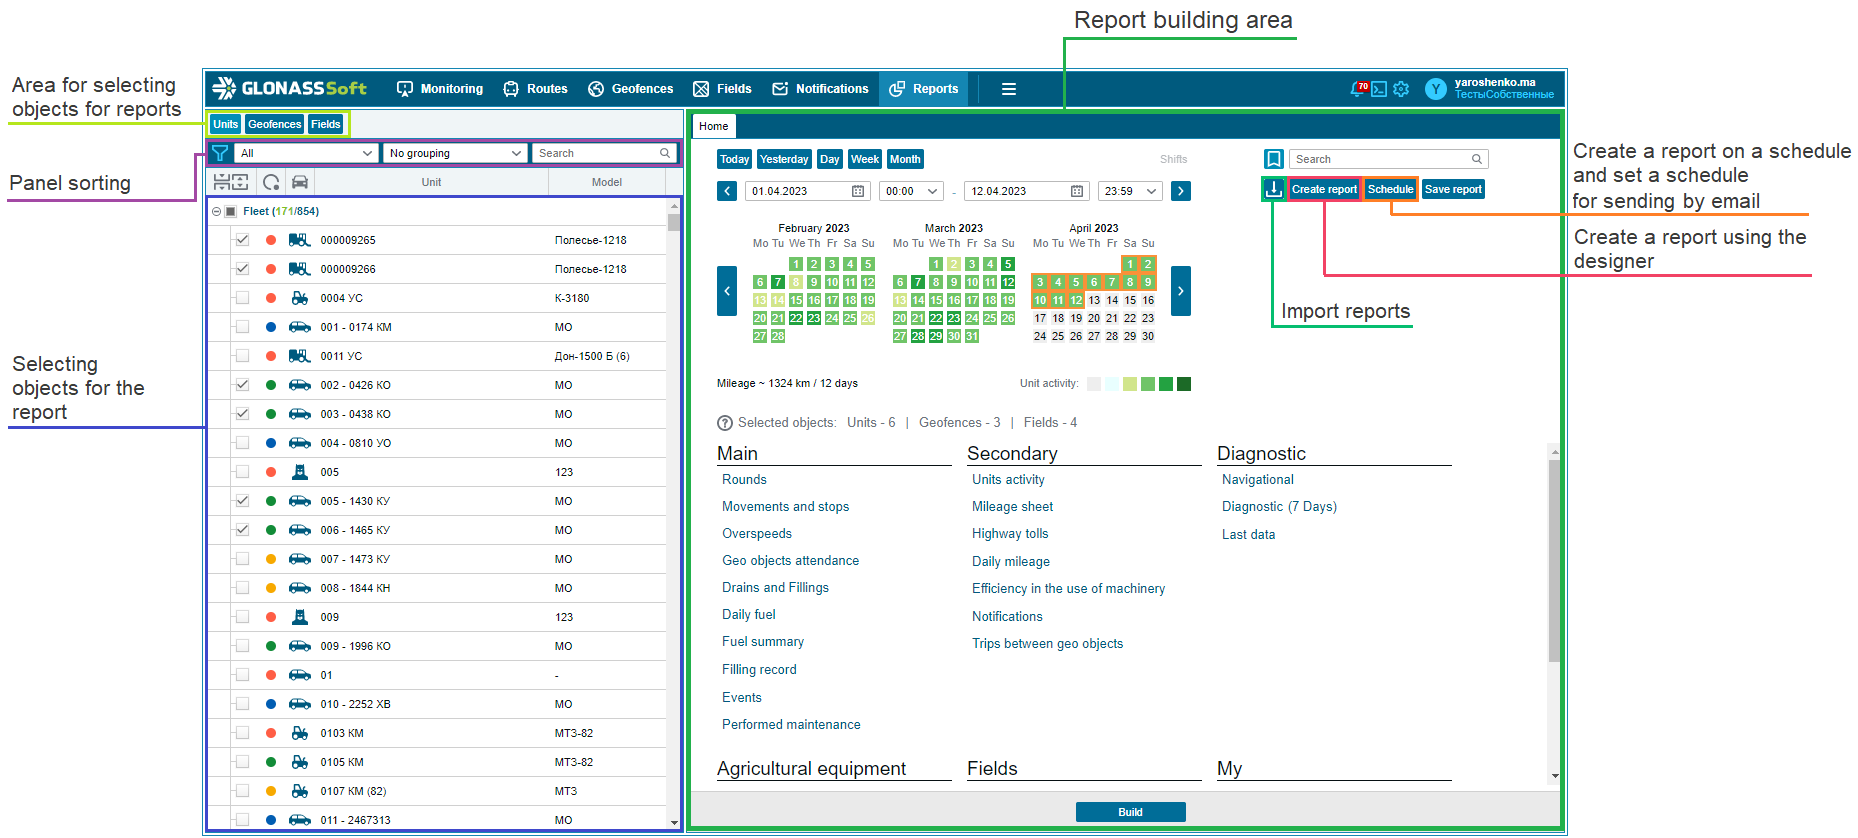
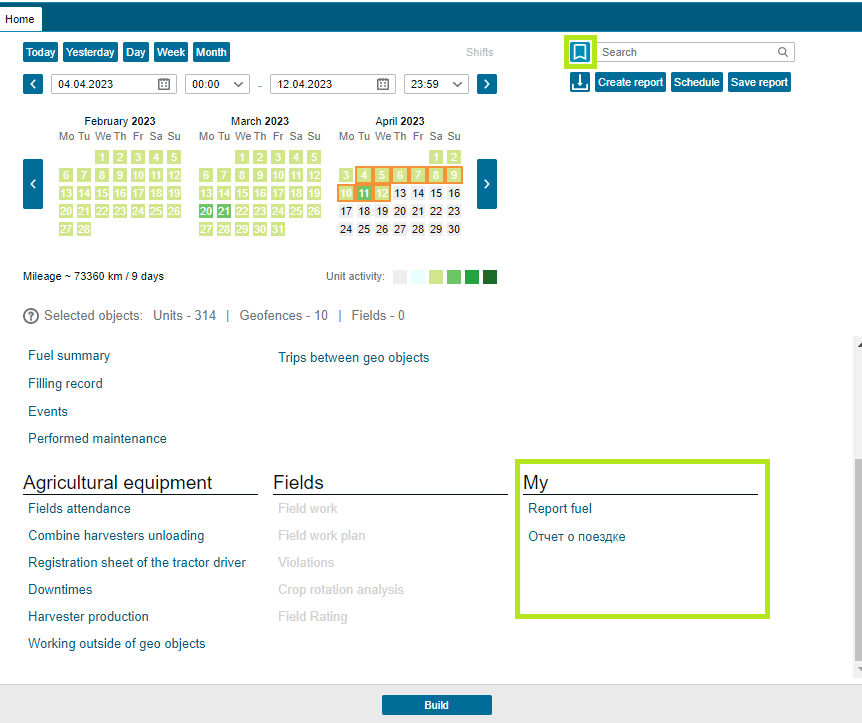
To build a report, you must perform the following sequence of actions:
Select objects for the report. Both vehicles and geo objects are available for selection. Report types differ for different types of objects. When selected, filtering, sorting and selection tools are available. The report object selection area contains vehicles or geoobjects that can be selected. Reports are built for the marked objects in the area for selecting report objects;
Select Reporting Period ;
Select a report type.
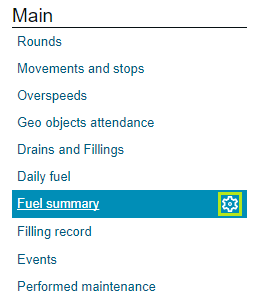
The "Settings" tool helps you find and configure the necessary report parameters in the general settings menu.
The main set of reports is divided into basic and additional. The following types of reports are available:
Basic
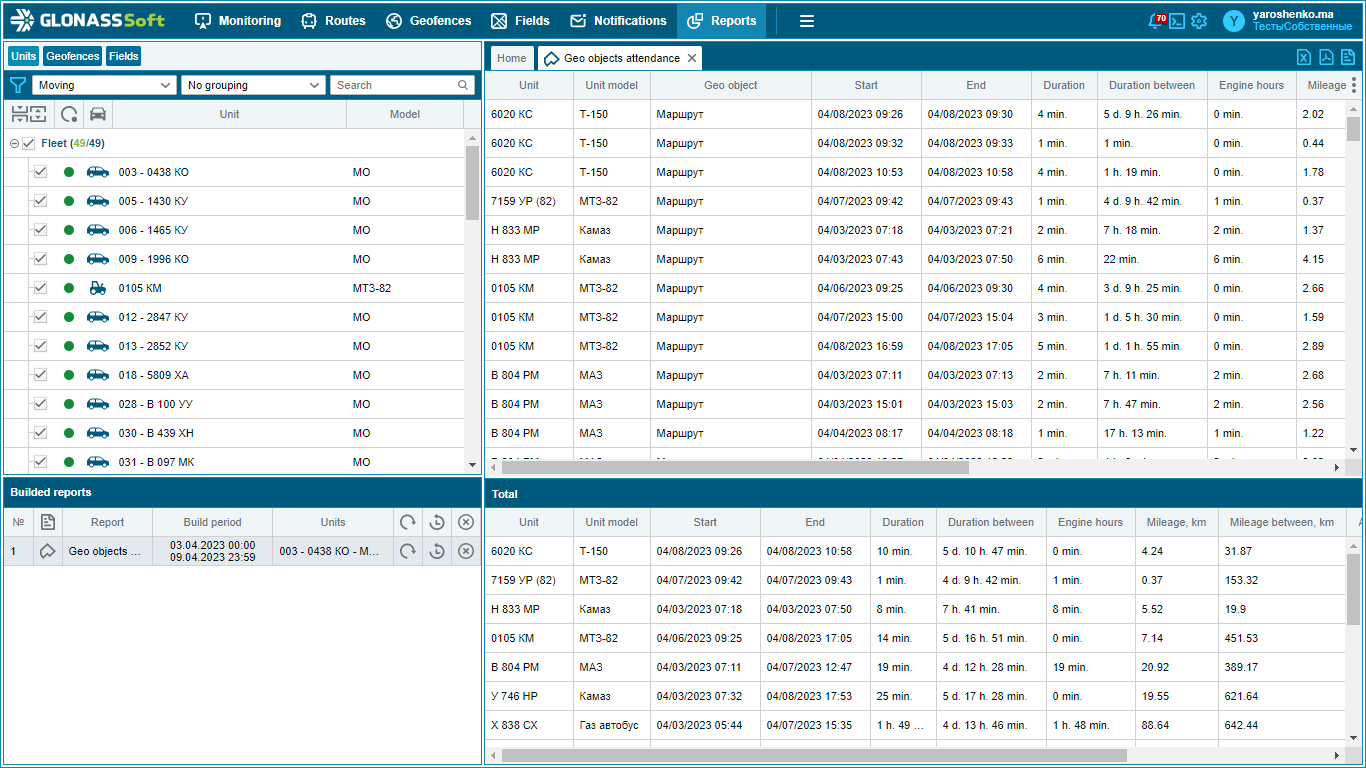
Visiting Geoobjects - displays the attendance of the selected geoobjects by the selected monitoring objects. The report includes the name of the objects, the name of the geoobjects, the time of entering the geoobject, the time of leaving the geoobject, the duration of visiting the geoobject. You can set up viewing visits to geo objects in several scenarios:
- when selecting a geo object, we will get all visits to this geo object by objects;
- when selecting an object, you will get a display of all geofences visited by the selected object;
- if we select the objects and geofences of interest to us, the visits of which we are interested to see, then we will get the intersection of these parameters, that is, visits to specific objects of specific geofences. To use this scenario, you need to go to the reports section and build a report on Geoobjects .
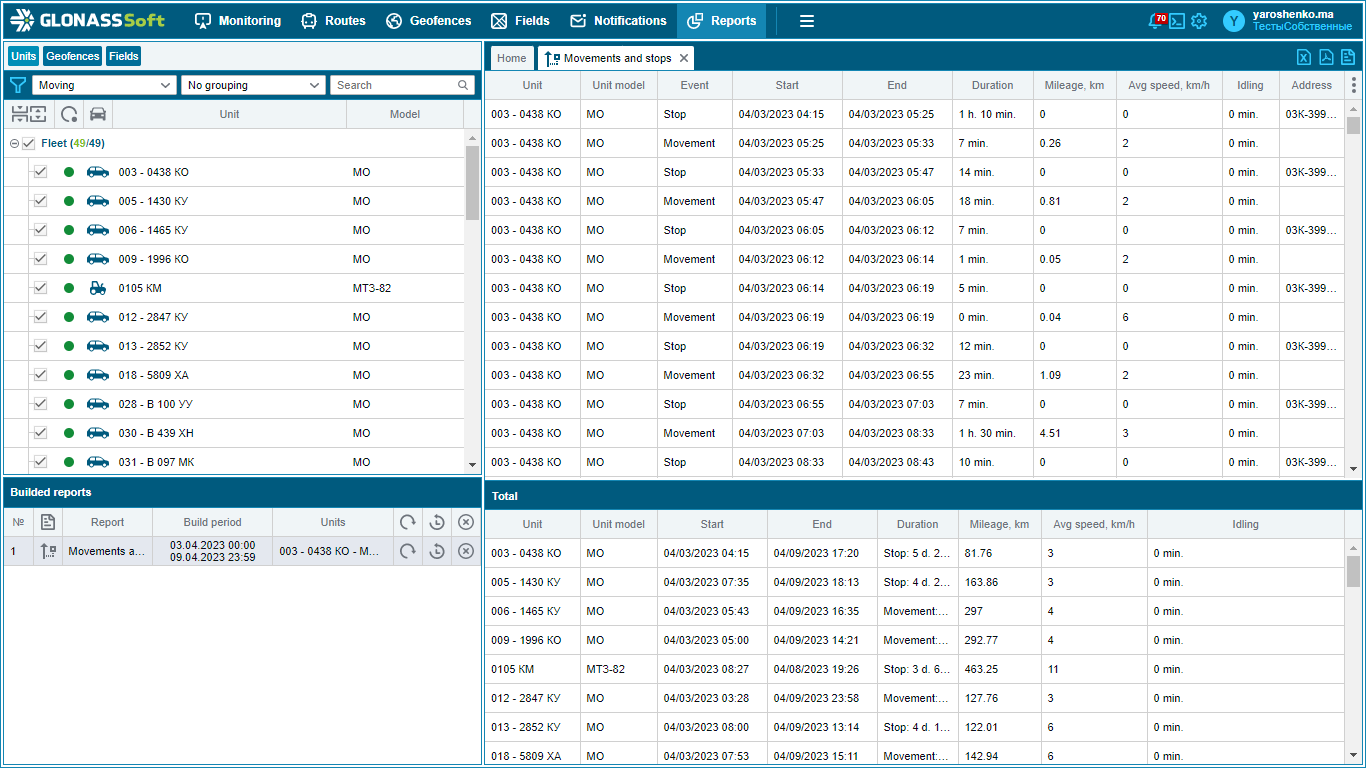
Movements and stops - displays data on the movement and stops of the selected monitoring objects. Contains such data as the state registration number of the object, the name of the event (movement, stop), the start time of the event, the end time of the event, the duration of the event, mileage (in km, for the event Stop = 0), average speed (in km/h), object location address;
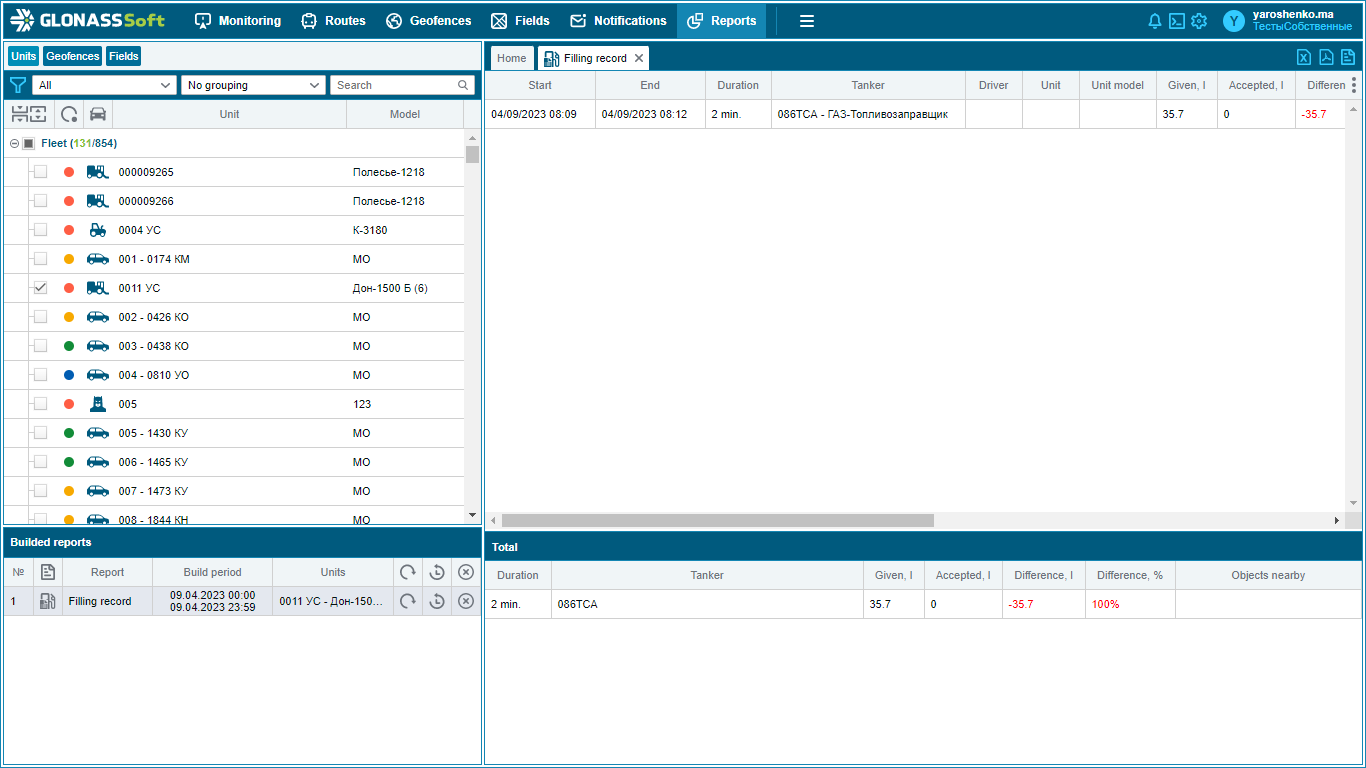
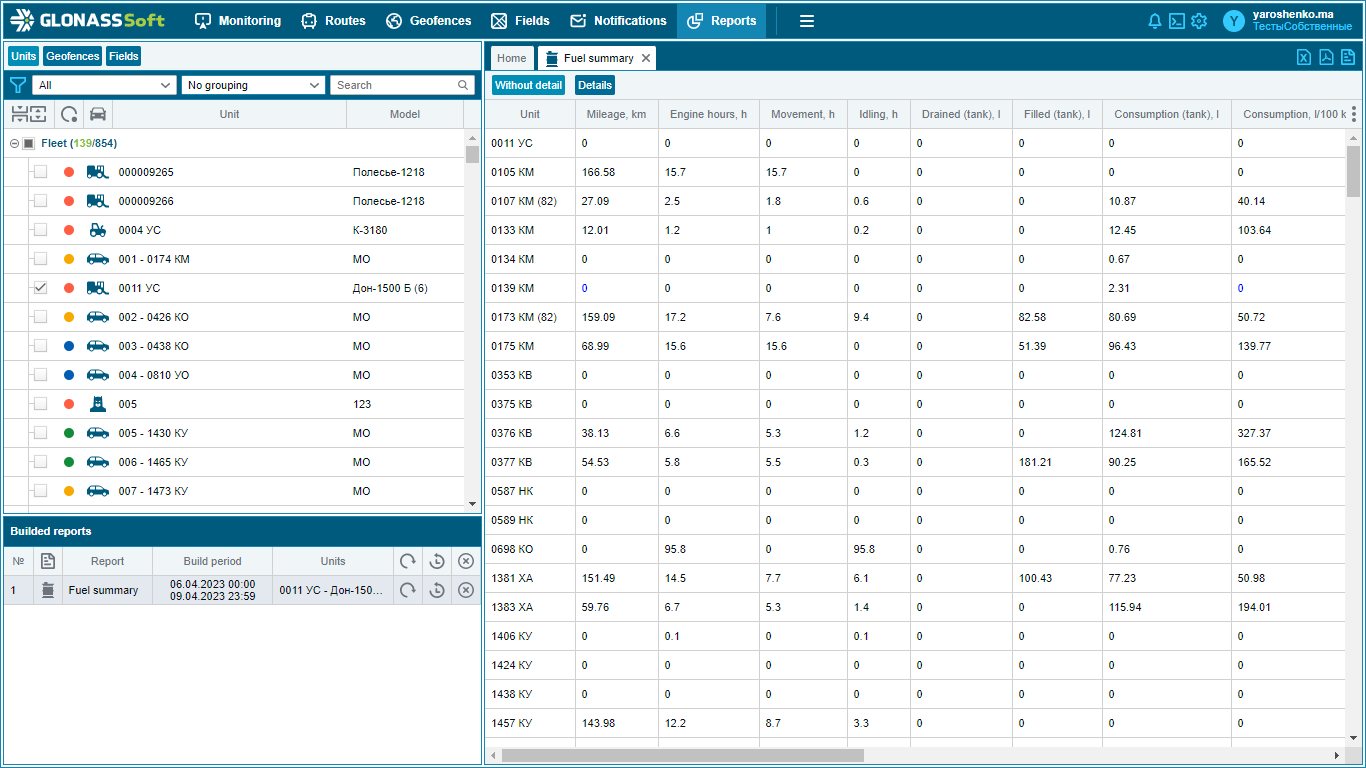
Refueling list - displays data on refueling of selected monitoring objects;
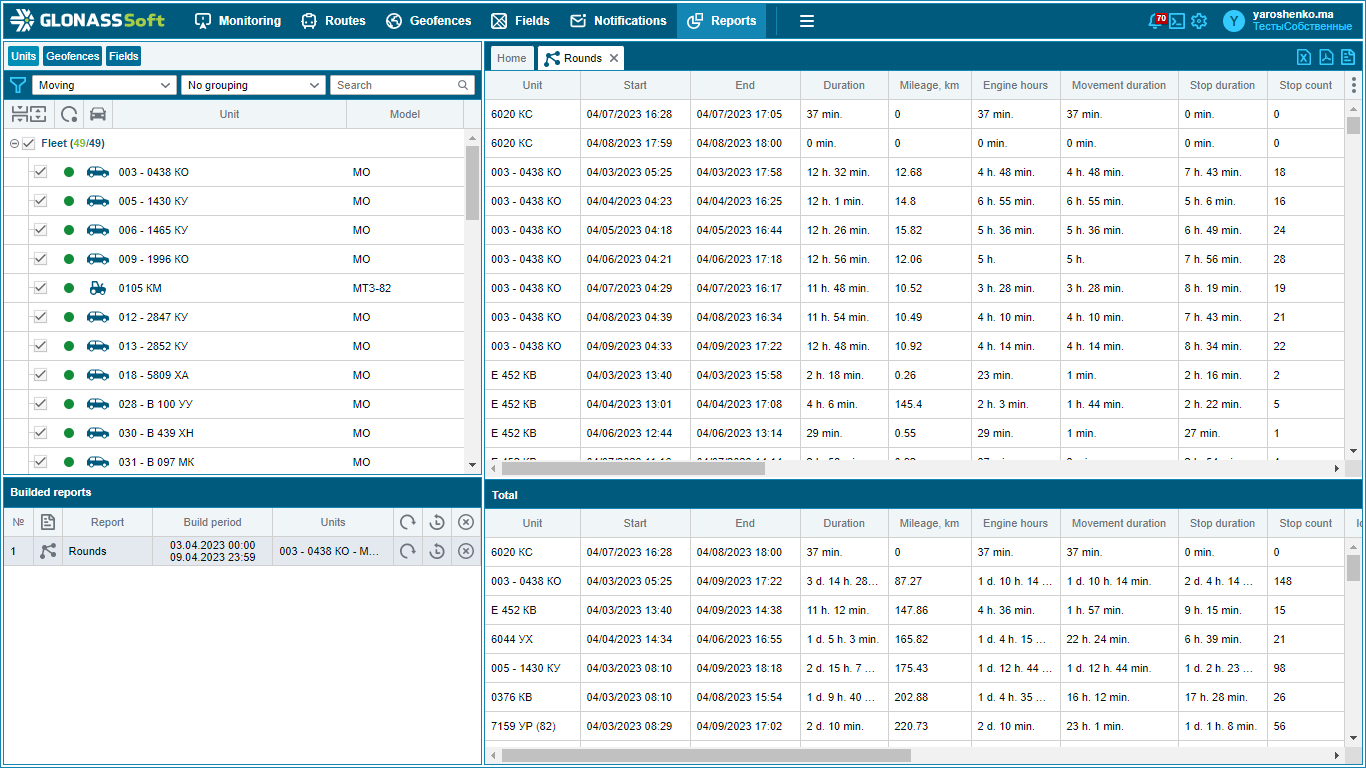
Flights - displays summary data on mileage, engine hours, fuel for flights for a selected period of time;
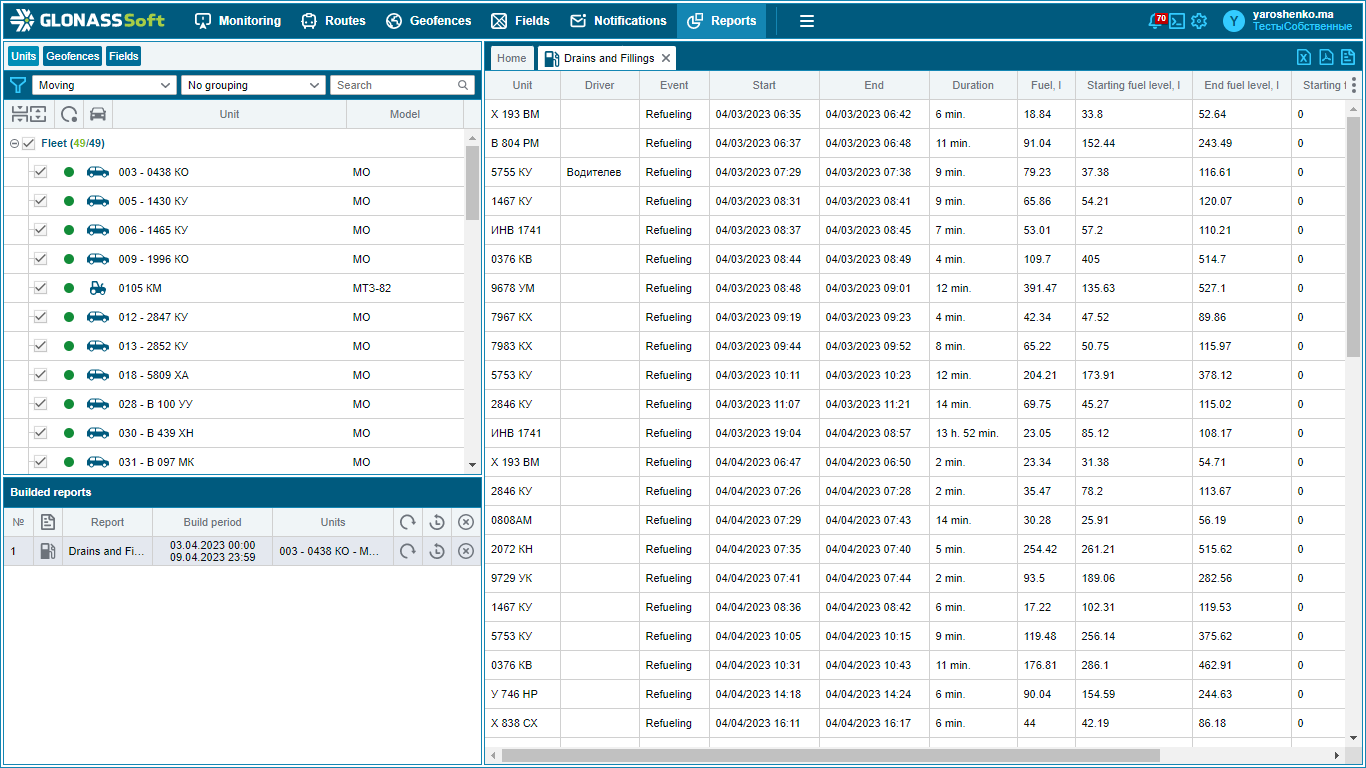
Drains and refills - should display data on fuel drains and refills by selected monitoring objects. The report includes the state registration number of the object, the model of the object, the name of the event (draining, refueling), the start and end time of the event, the duration of the event, the amount of fuel drained or filled, address;
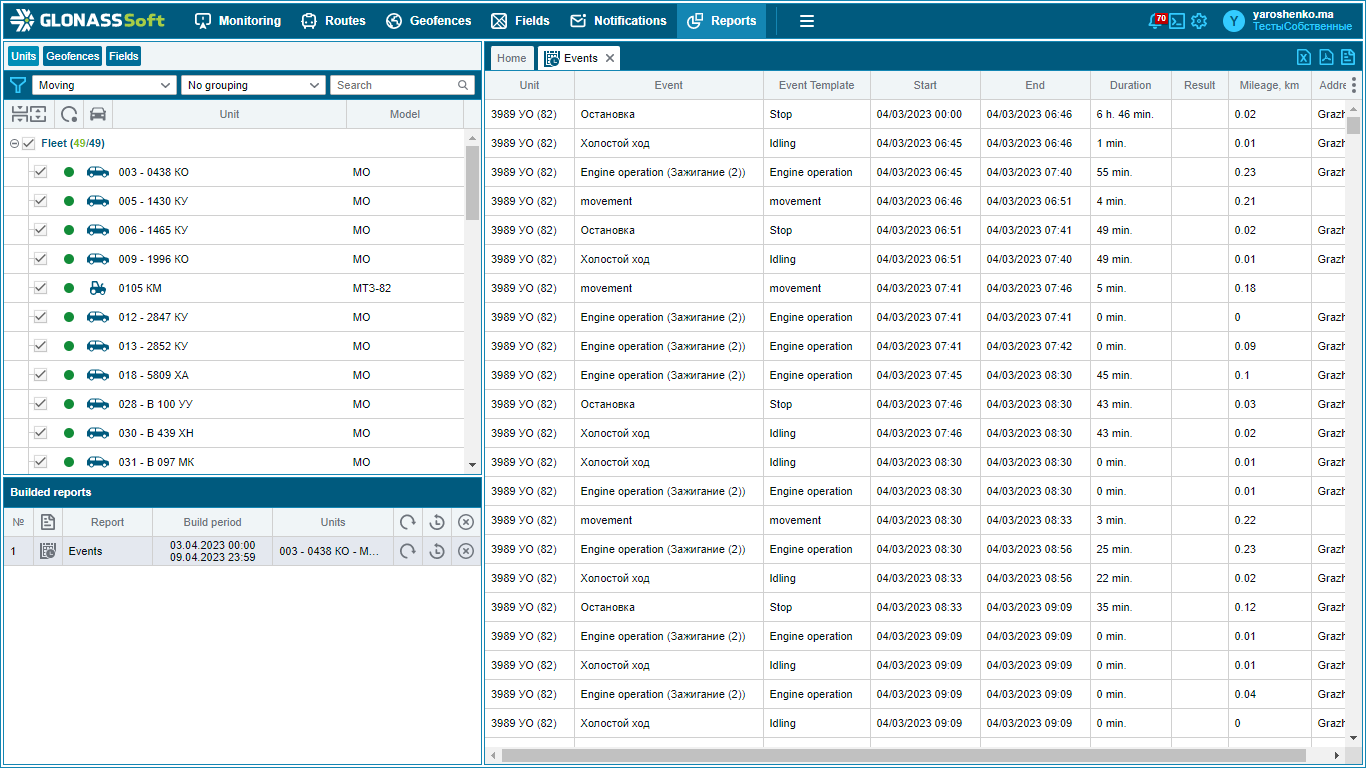
Events - Events - shows the chronology of all events that happened to the objects for the selected period of time, including the display of trigger events of arbitrary sensors;
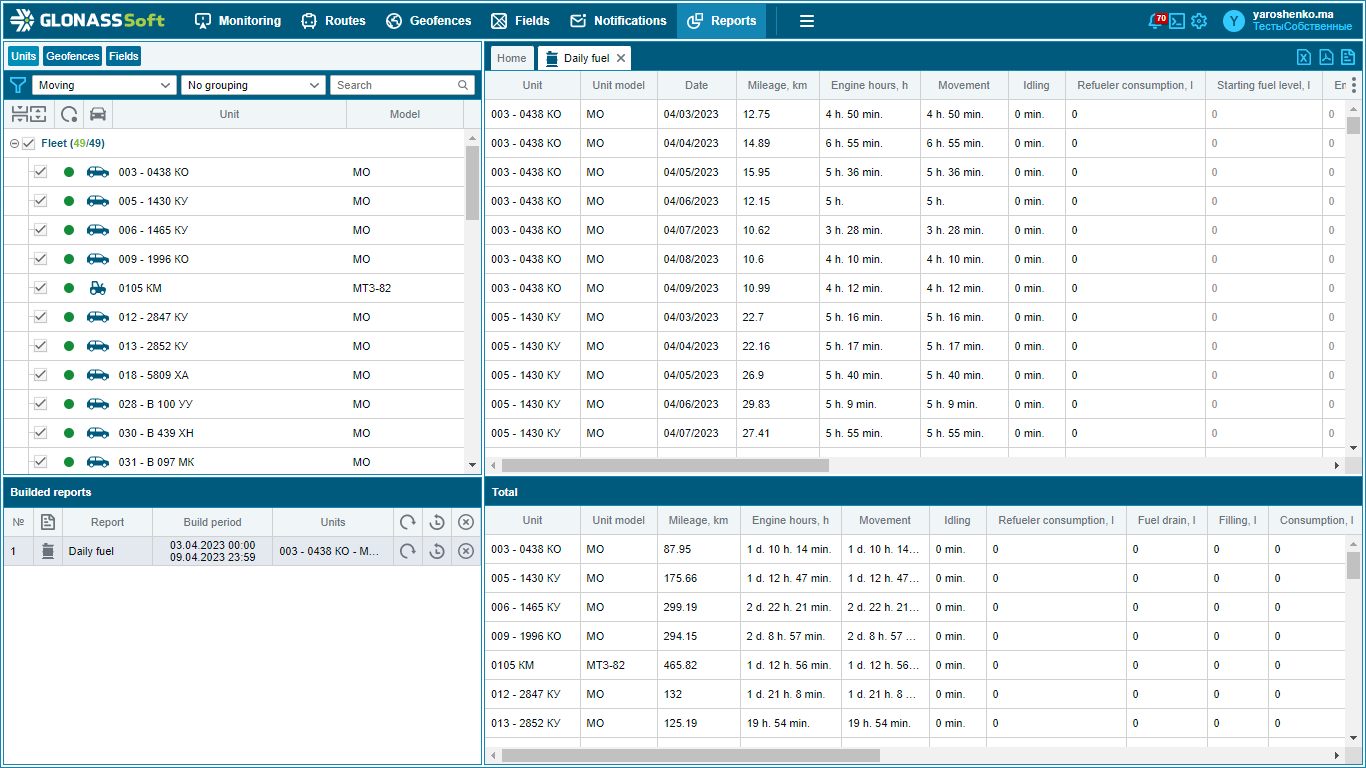
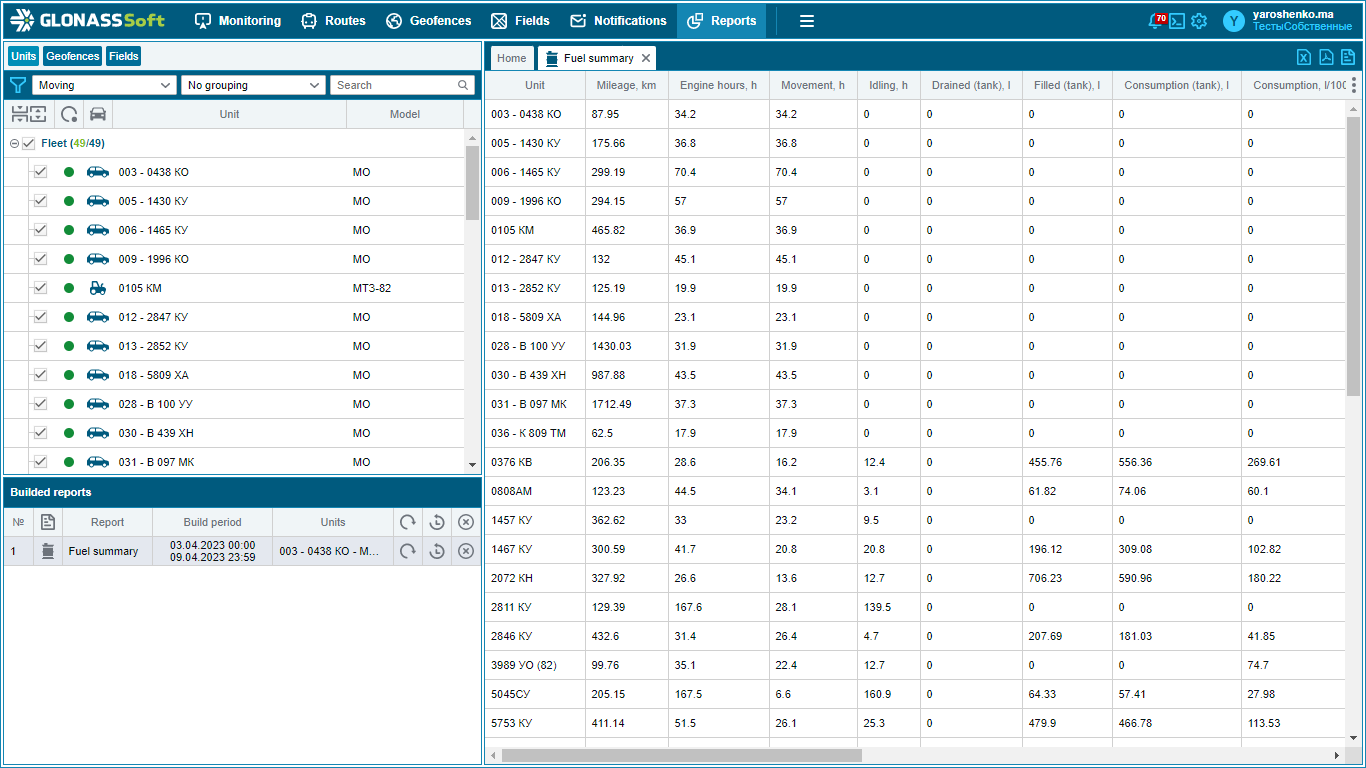
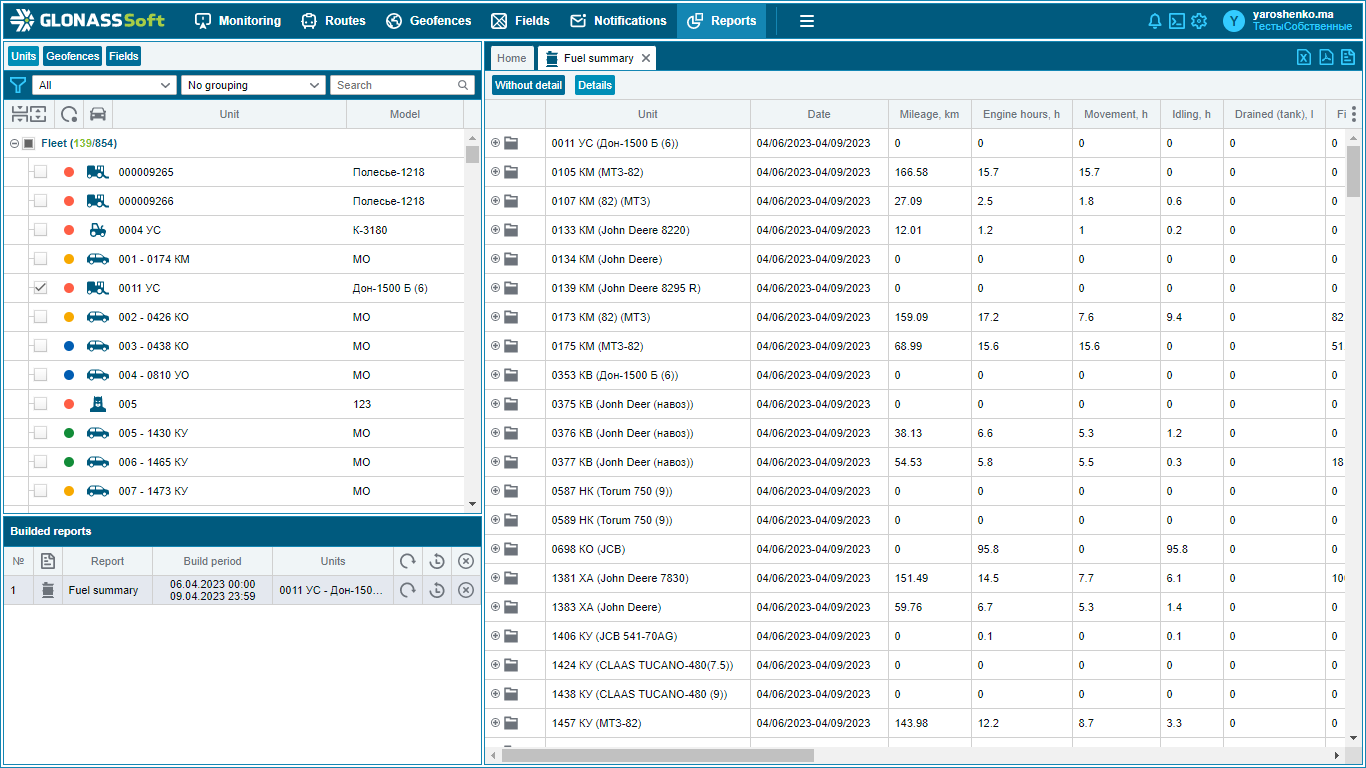
Daily fuel and Summary fuel - display fuel data for the selected monitoring object in different formats.
Additional
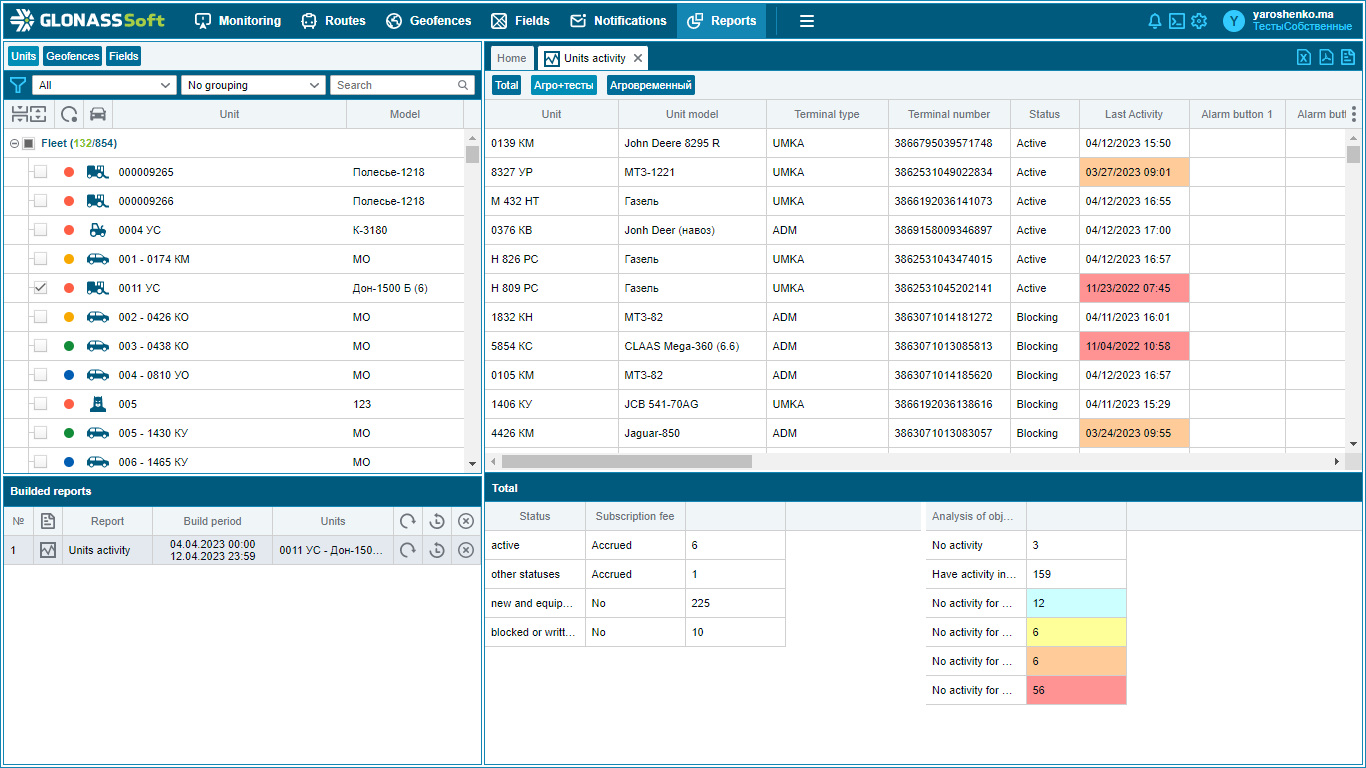
Object activity - shows the total time of object activity for the period. For a sensor with the "virtual" type, the activity time is not considered. If the sensor is part of a virtual sensor, then it is not displayed in the report;
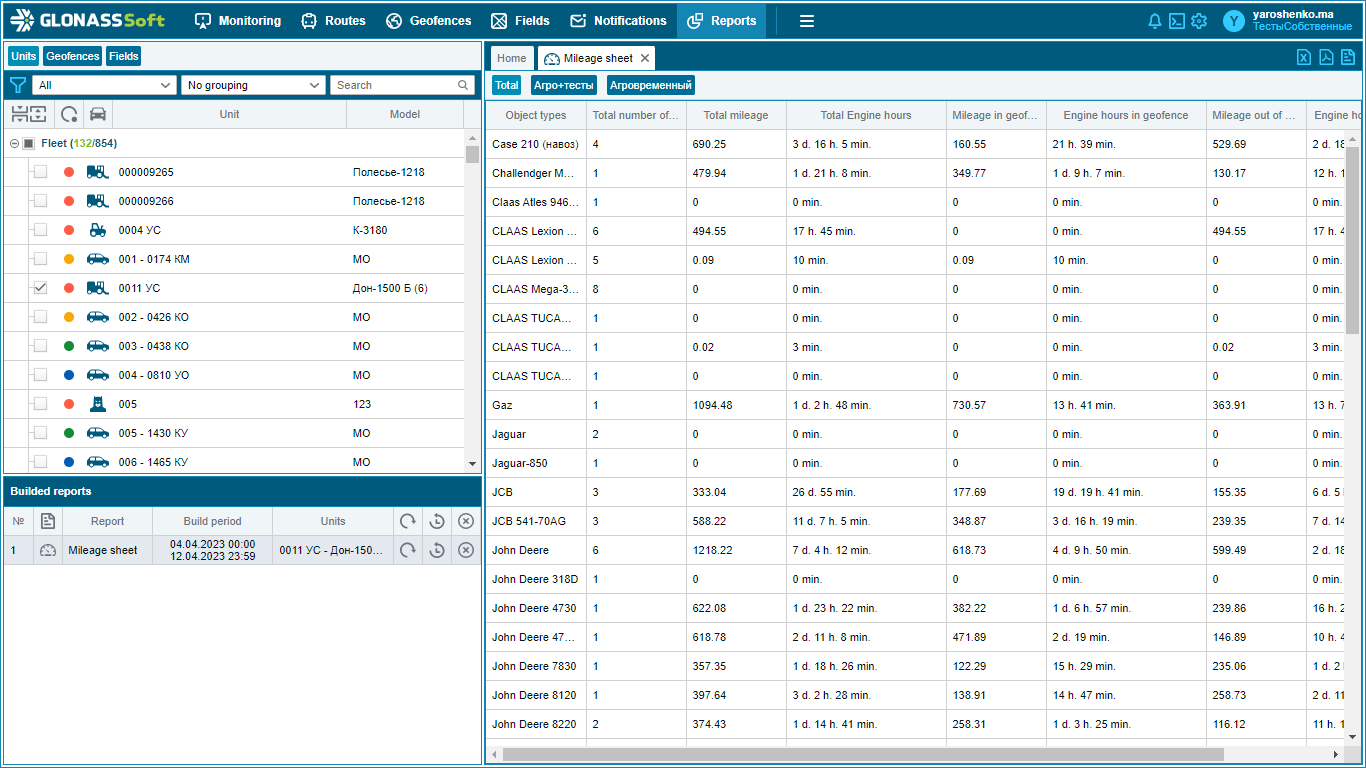
Mileage record - shows the total run time and the number of hours worked for the object while in geo-objects (geo-fences);
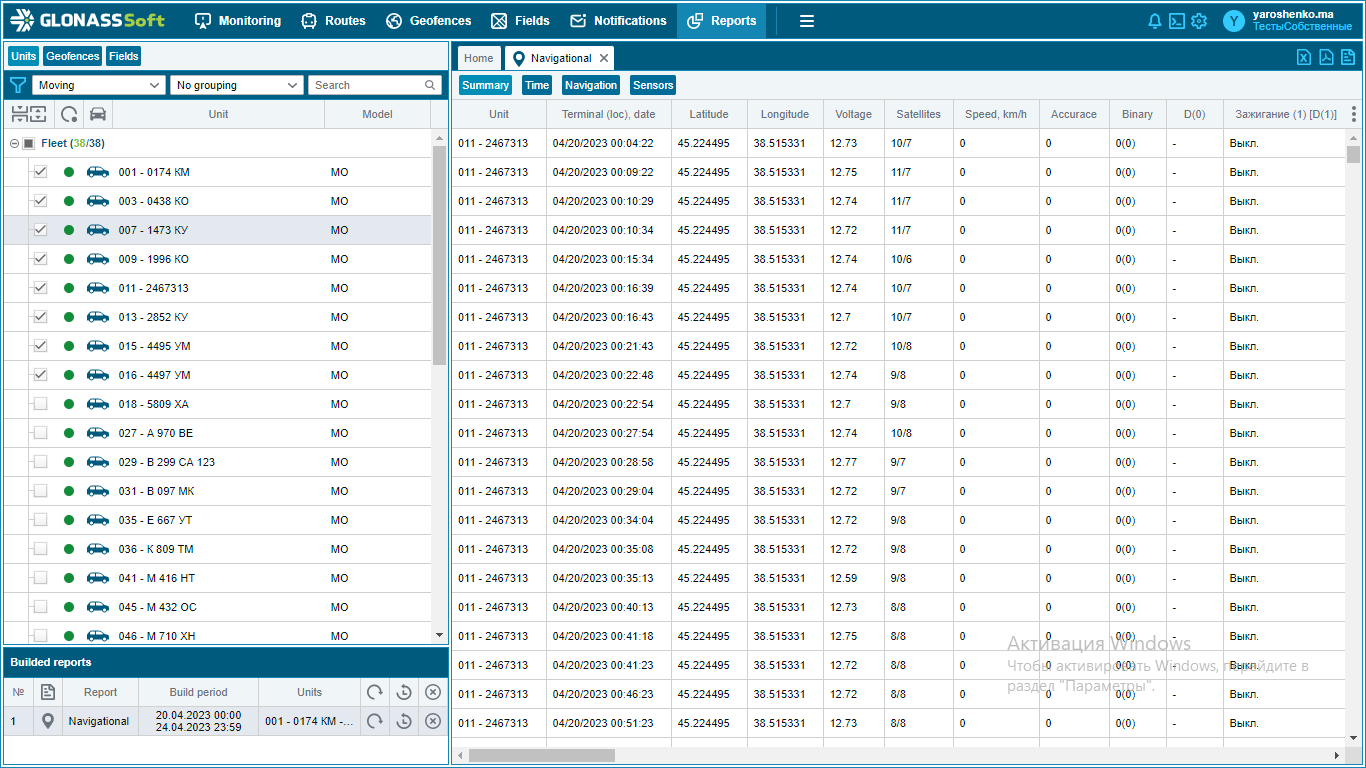
Navigational - displays navigation data of the selected monitoring object. The report includes: time, coordinates of the object at the selected time, values and initial data of sensors installed on the monitoring object;
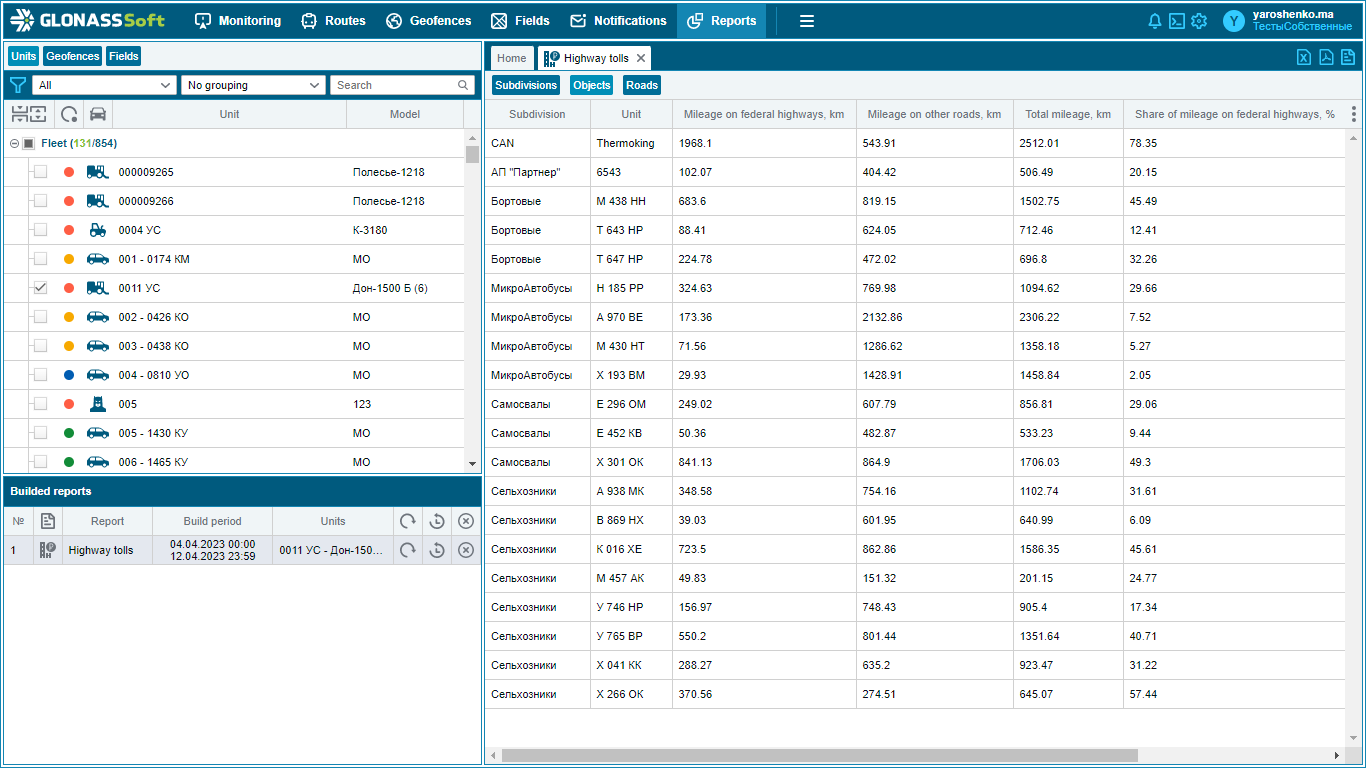
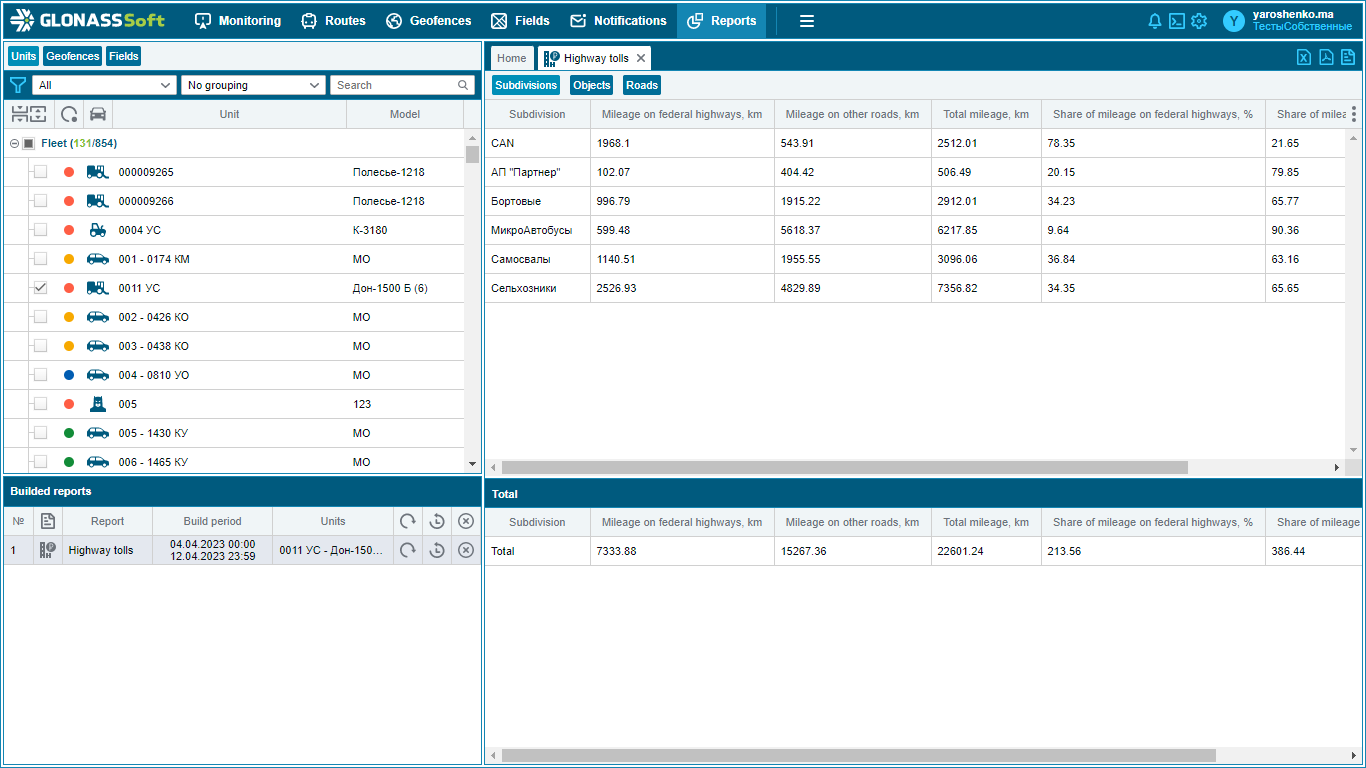
Toll on routes - allows you to estimate the cost of transportation on routes, taking into account the available information collected;
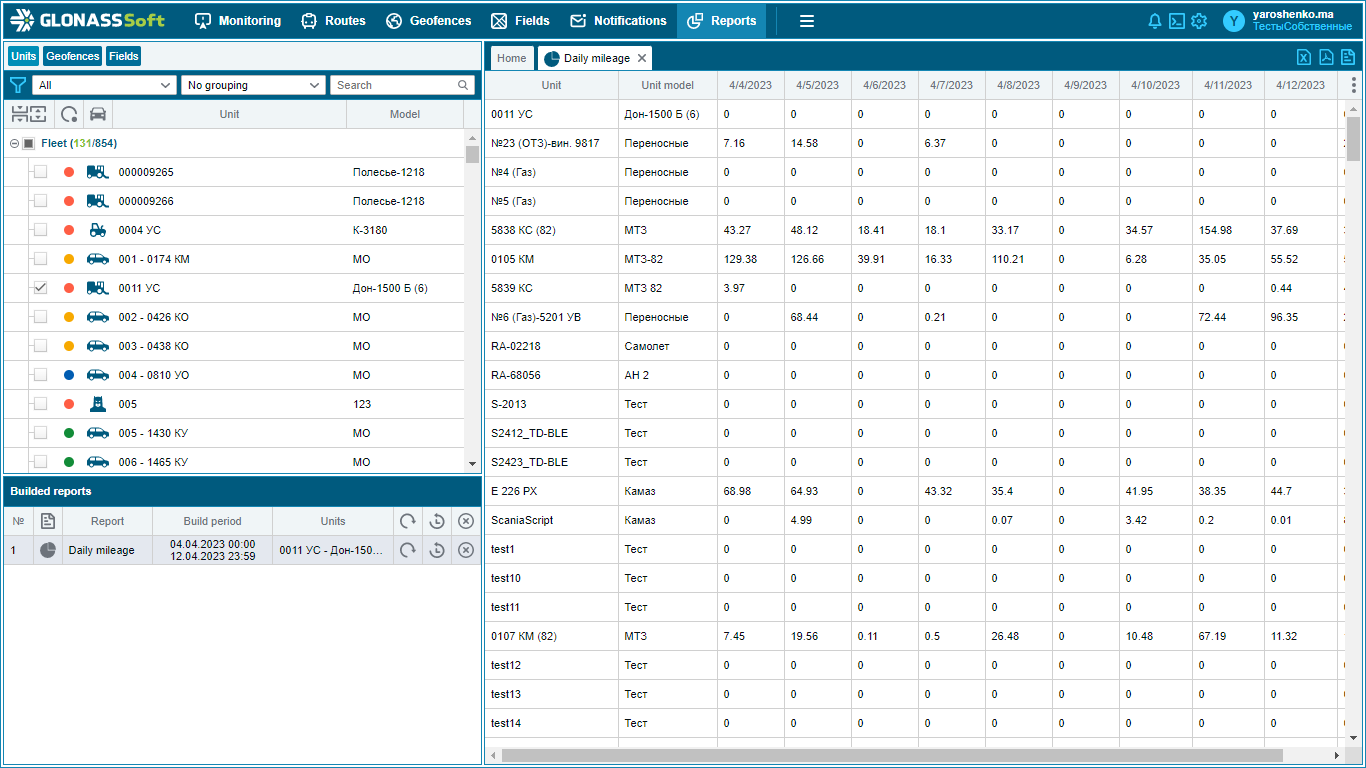
Daily runs - shows the daily runs of the object for the selected period.
Buttons for working with documents allow you to send the selected report for printing, as well as export it in document formats .xlsx, .pdf.

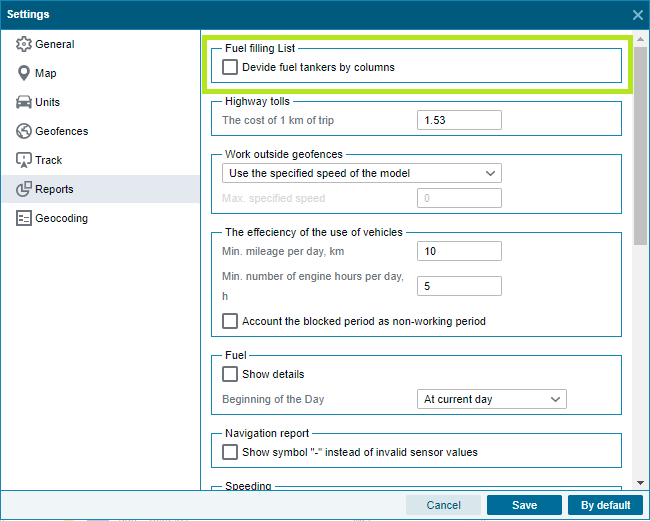
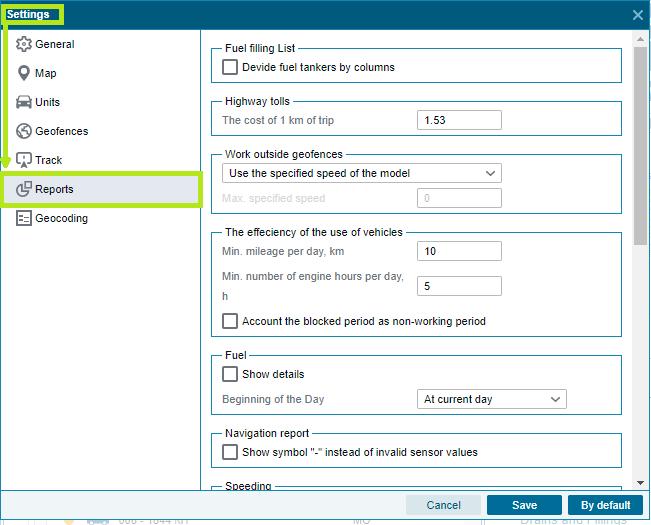
In the user settings in the "Reports" section, you can configure the display of the following parameters:
Filling lists - breakdown of tankers by columns;
Fare on federal highways - entering the cost per 1 km of travel;
Efficiency of using equipment - displaying the minimum mileage and the number of hours per day, the ability to consider the blocked period as non-working;
Fuel - displaying the daily fuel accounting parameter;
Exceeding the speed - the ability to select the method for determining the speed limit (fixed or road limit), as well as the exclusion from the report of a non-penalized speed interval;
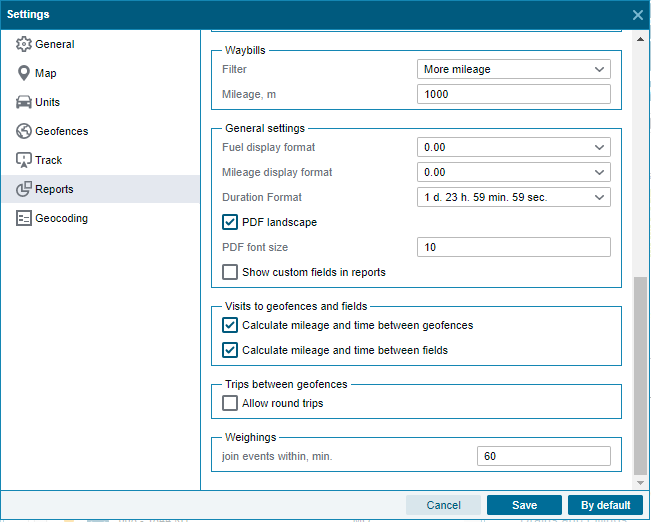
Waybills ;
General settings - display format for fuel, mileage and duration;
Visiting geo-objects and fields - the ability to calculate the mileage and time between geo-objects and fields;
Weighings - the ability to combine events, that is, weighings, for a time period that we can choose ourselves.
My
All client reports created using Report Designer are displayed. In order to see reports of this type, you must click on the "Show my reports" button -  :
: